Locations from Google Map
web scraping
This question on Stack Overflow was a fun challenge: extract the markers off an embedded Google Map. This is what the original map looks like: Delving into.
This question on Stack Overflow was a fun challenge: extract the markers off an embedded Google Map.
This is what the original map looks like:
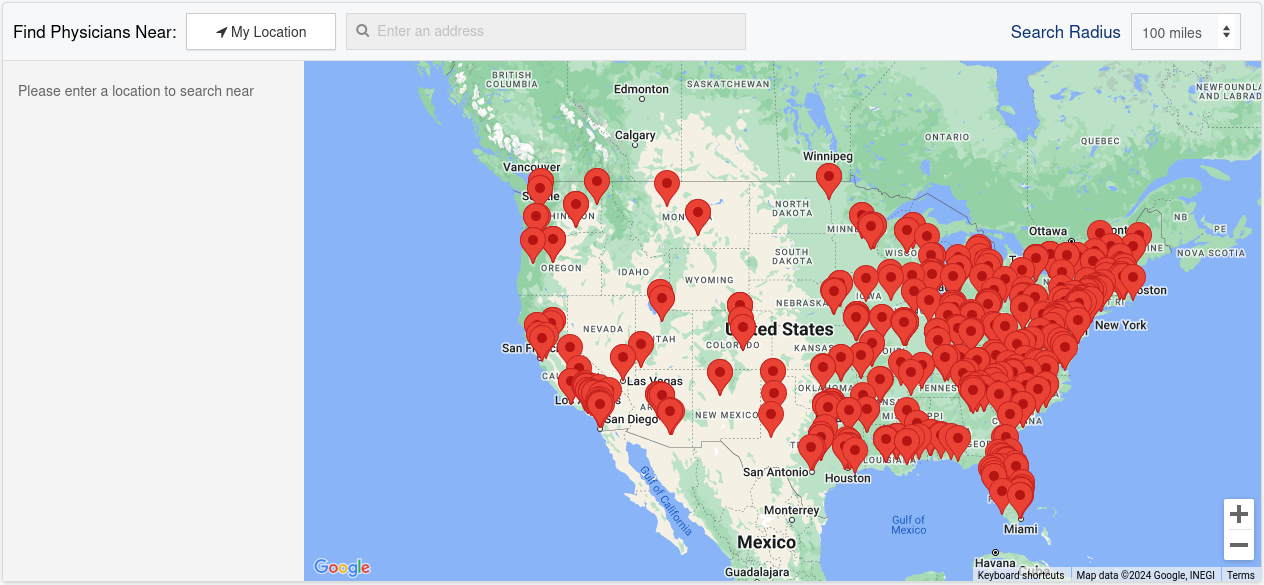
Delving into the API calls behind the site I found a GET request to https://cdn.storelocatorwidgets.com/ that retrieved the required data. A quick Python script retrieved the data.
import json
import requests
import re

UA = "Mozilla/5.0 (X11; Linux x86_64) Gecko/20100101 Firefox/125.0"

headers = {
    "User-Agent": "",
    "Accept": "*/*",
    "Accept-Language": "en-US,en;q=0.5",
    "Connection": "keep-alive",
    "Referer": "https://silkroadmed.com/",
    "Sec-Fetch-Dest": "script",
    "Sec-Fetch-Mode": "no-cors",
    "Sec-Fetch-Site": "cross-site",
}

params = {
    "callback": "slw",
    "_": "1716699895443",
}

response = requests.get(
    "https://cdn.storelocatorwidgets.com/json/AJ587baQBwcvO8ZBAoQKFx0r5DhPhcub",
    params=params,
    headers=headers,
)

data = response.text

# The JSON is wrapped in "slw(...)".
#
data = re.sub("^slw\(|\)$", "", data)

data = json.loads(data)

with open("hospital-locations.json", "wt") as file:
    json.dump(data, file, indent=2)

with open("hospital-locations.csv", "wt") as file:
    file.write("name,lat,lon\n")
    for location in data["stores"]:
        file.write('"%s", %f, %f\n' % (
            location["name"],
            location["data"]["map_lat"],
            location["data"]["map_lng"]
            )
        )
I dumped it to both JSON (including some metadata) and CSV (just the names and locations).
To validate the data I loaded it into R.
library(readr)

locations <- read_csv("hospital-locations.csv")
Checked the first few records.
head(locations)# A tibble: 6 × 3
name lat lon
<chr> <dbl> <dbl>
1 Aashish P Gupta, MD 28.1 -80.6
2 Abdallah Naddaf, MD 40.9 -79.9
3 Abindra Sigdel, MD 38.2 -85.8
4 Adam D. Levitt, MD 28.5 -81.4
5 Adam Keefer, MD 32.8 -79.9
6 Adam Ring, MD 37.5 -122. And plotted.
library(leaflet)

leaflet(locations) |>
  addTiles() |>
  addCircleMarkers(popup = ~name) |>
  setView(
    lng = -96,
    lat = 37,
    zoom = 3.5
  )
Looks good.