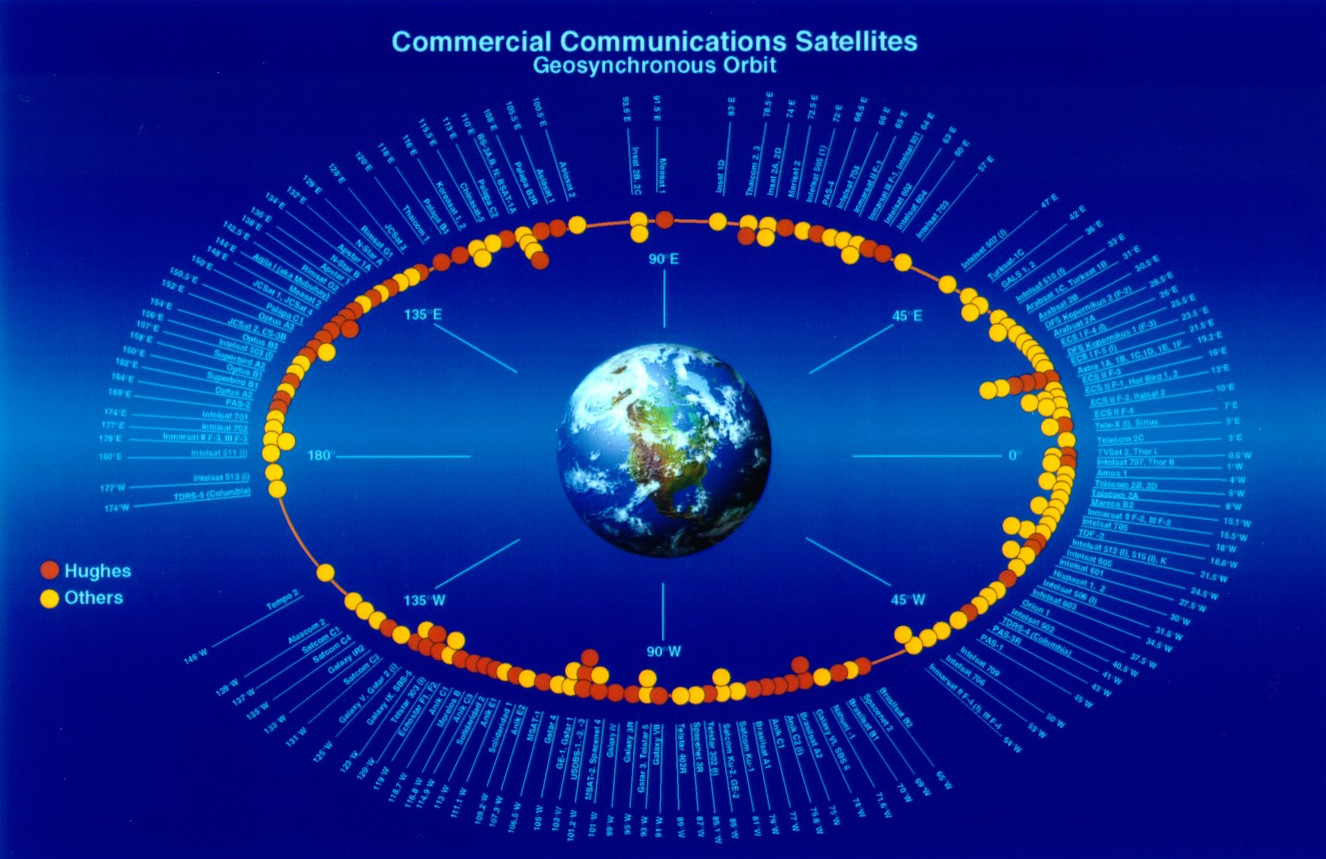
A year or so ago I went to a talk which included a diagram showing the locations of Earth’s fleet of geosynchronous satellites. According to the speaker, the information in this diagram was already quite dated: the satellites and their locations had changed.
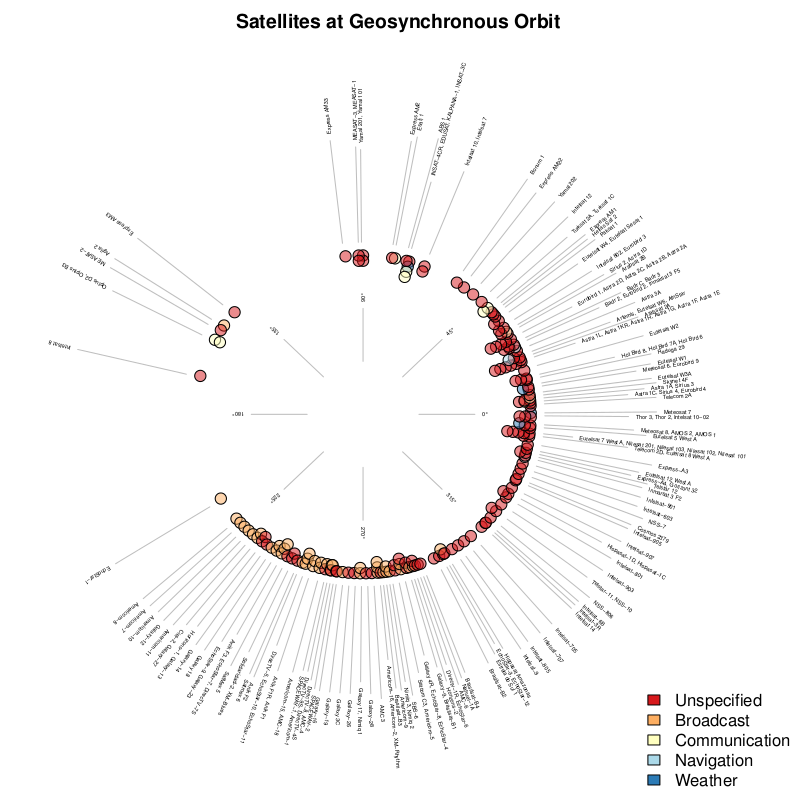
I decided to update the diagram using the locations of satellites from the list of geosynchronous satellites published on Wikipedia. Probably not the most definitive source of data on this subject, but it was a good starting point.

First, grab the Wikipedia page and extract the two tables (one for satellites over each of the eastern and western hemispheres. Then concatenate those tables.
download.file("https://en.wikipedia.org/wiki/List\_of\_satellites\_in\_geosynchronous_orbit",
              "wiki-geosynchronous-satellites.html")
#
W = readHTMLTable("wiki-geosynchronous-satellites.html", which = 3, trim = TRUE,
stringsAsFactors = FALSE)
E = readHTMLTable("wiki-geosynchronous-satellites.html", which = 4, trim = TRUE,
stringsAsFactors = FALSE)
#
geosat = rbind(W, E)
The longitude column indicates whether the satellites are east (E) or west (W) of the prime meridian. It is going to be more convenient to convert these to numerical values and make the ones that are to the west negative.
index = grep("°W", geosat[,1])
geosat[index, 1] = paste0("-", geosat[index, 1])
#
geosat[,1] = sub("°[WE]$", "", geosat[,1])
After some housekeeping, converting the range of longitudes from [-180°,180°) to [0°,360°), and retaining only the necessary columns, we end up with data that looks like this:
head(geosat)
  Location   Satellite      Type
1      212  EchoStar-1 Broadcast
2      221  Americom-8 Broadcast
3      223  Americom-7 Broadcast
4      225 Americom-10 Broadcast
5      227   Galaxy-12 Broadcast
6      229 Americom-11 Broadcast
Well, that is really the tricky stuff. Generating the plots was quite straight forward. First I grouped the longitudes into bins. Then, for each bin
- assigned radial distance vector for satellites (not realistic, but allowed bins with multiple satellites to be plotted neatly);
- converted longitude and radial distance into Cartesian coordinates;
- plotted points at these locations; and
- inserted labels.
This is the result:

Have a look at a higher resolution PDF version.