A couple of years ago I implemented an automated trading algorithm for a strategy called the “Cable Morning Trade”. The basis of the strategy is the range of GBPUSD during the interval 05:00 to 09:00 London time. Two buy stop orders are placed 5 points above the highest high for this period; two sell stop orders are placed 5 points below the lowest low. All orders have a protective stop at 40 points. When either the buy or sell orders are filled, the other orders are cancelled. Of the filled orders, one exits at a profit equal to the stop loss, while the other is left to run until the close of the London session.
The strategy description claimed that it “loses 3 out of every 8 trades; wins make good money, losses are small”. However, this promise was never filled in practice, which was rather disappointing: it sounded like a pretty solid strategy.
My interest in the strategy was renewed last week when I spoke to a colleague who has been successfully trading a similar strategy on the Dow Jones, only using the New York market times rather than London.
This got me thinking: maybe the conditions for this strategy no longer apply. To investigate this issue, I compiled the statistics of the range (High - Low) and motion (|Close - Open|) from four year’s data on both the GBPUSD and EURUSD.
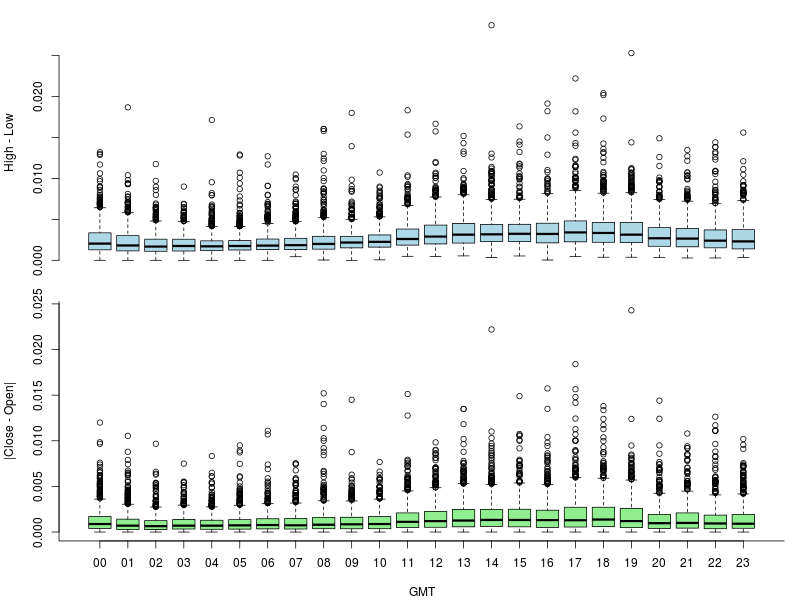
First let’s look at the GBPUSD. The distribution of the range and motion are plotted as a function of GMT below. The only evidence of a diurnal pattern is a slight increase in the afternoon to evening (12:00 GMT to 19:00 GMT). Now this corresponds to the New York rather than the London session. An interesting start. Perhaps London was the dominant session for the GBPUSD at the time that the strategy was devised, but that it has now shifted to the New York session?
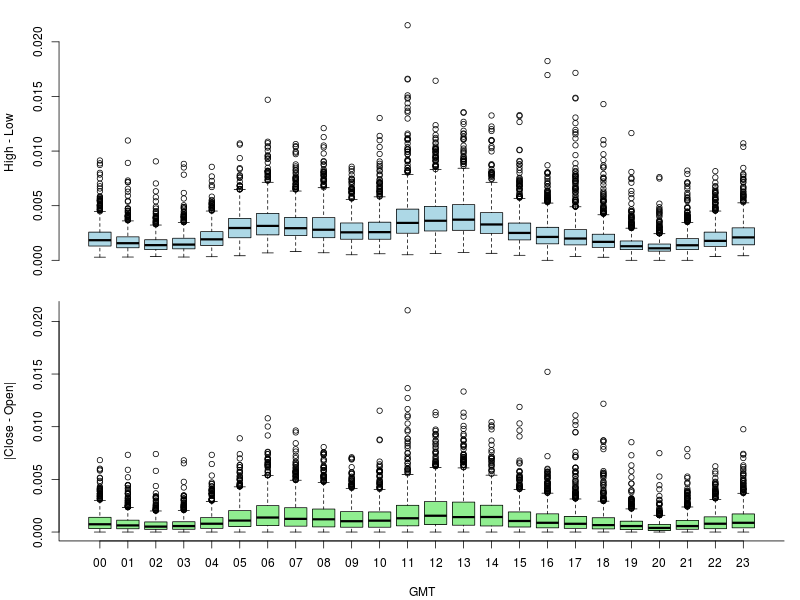
Next consider the analogous data for the EURUSD. Here it is apparent that there is a much higher level of diurnal variation, with both the range and the motion of the EURUSD being active between 05:00 GMT and 15:00 GMT.
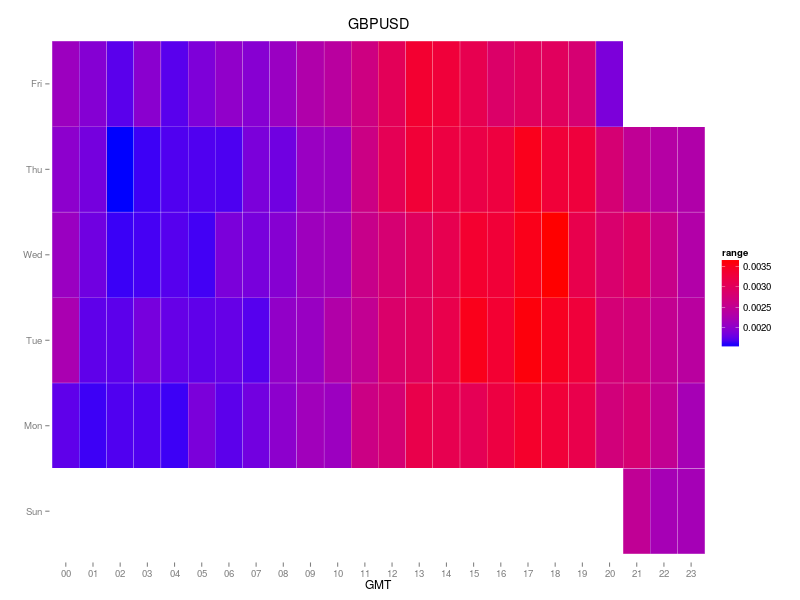
Perhaps some of the details have been hidden by the diurnal aggregation? The markets also exhibit a hebdomadal variability. To evaluate the effect of both diurnal and day of week variations, I generated heat maps for the range as a function of GMT and day of week. The GBPUSD data confirm the conclusions above: not too much happening during the beginning of the London session, with things picking up around the open of the New York session. This pattern persists on all days of the week but it is perhaps slightly weaker on Mondays and Fridays.
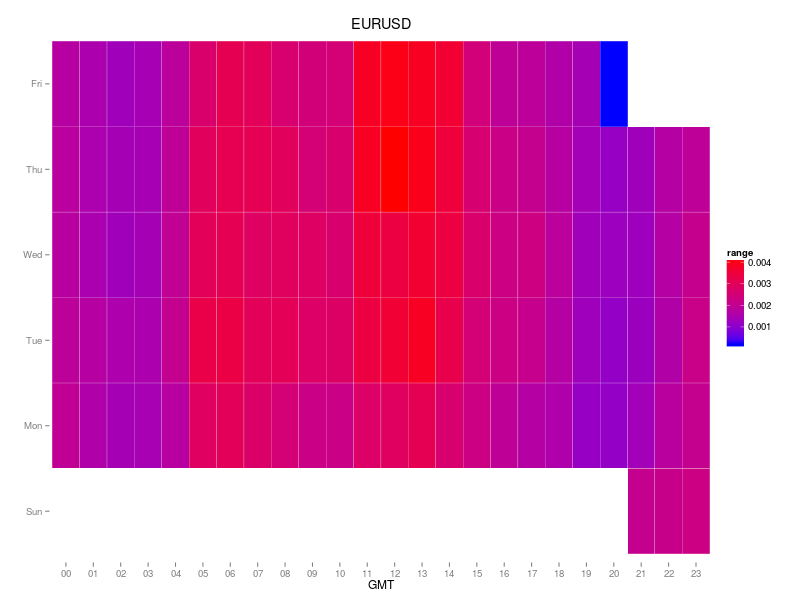
The heatmap for EURUSD also agrees with the analysis above: activity is highest between 05:00 GMT and 15:00 GMT, but there is evidence of both an “early” and a “later” period.
What does all of this say about the future of the Cable Morning Trade? Well, as applied to GBPUSD I would probably need to move the trading hours to later in the day. However, the stronger diurnal pattern on the EURUSD suggests that it might actually be a better candidate for this strategy. I will test this in practice and report back.