I am working on a project related to secondary effects of earthquakes. To guide me in the analysis I need a chart showing the location, magnitude and depth of recent earthquakes. A host of such charts are already available, but since I had the required data on hand, it seemed like a good idea to take a stab at it myself.
Getting the Data
The data was sourced from the US Geological Survey web site. I selected dates for the decade between 1 January 2004 and 1 January 2013, magnitudes greater than 5 and chose CSV as the output format.
Loading the data into R is then simple. Some small transformations are required in order to interpret the time field in the data. I discarded a few columns which were not going to be useful, and added fields for the year and date of observation (for convenience alone: these data were already in the time field).
catalog <- read.csv(file.path("data", "earthquake-catalog.csv"), stringsAsFactors = FALSE)
#
catalog <- within(catalog, {
   time <- sub("T", " ", time)
   time <- sub("Z", "", time)
   time <- strptime(time, format = "%Y-%m-%d %H:%M:%S")
   date <- as.Date(time)
   year <- as.integer(strftime(time, format = "%Y"))
})
catalog <- catalog[, c(12, 16, 17, 1, 2:5, 14)]
This is what the resulting data frame looks like:
head(catalog)
          id year       date                time latitude longitude depth mag                           place
1 usc000lv53 2013 2013-12-31 2013-12-31 23:41:47  19.1673  120.0807 10.28 5.2  92km NW of Davila, Philippines
2 usc000lv0r 2013 2013-12-31 2013-12-31 21:32:01  19.1223  120.1797 10.00 5.2 83km NNW of Davila, Philippines
3 usb000m2uh 2013 2013-12-31 2013-12-31 20:04:32  19.0589  120.3057 20.61 5.0 70km NNW of Davila, Philippines
4 usc000luwe 2013 2013-12-31 2013-12-31 20:01:06  19.1181  120.2719 10.95 5.7 77km NNW of Burgos, Philippines
5 usb000m2ub 2013 2013-12-31 2013-12-31 13:55:02 -17.6528 -173.6869 15.38 5.0      114km NNE of Neiafu, Tonga
6 usc000lumu 2013 2013-12-31 2013-12-31 08:36:30 -15.6555 -172.9340 31.82 5.1       93km ENE of Hihifo, Tonga
Making the Charts
Time to generate those charts.
require(ggplot2)
require(maps)
require(grid)

world.map <- map_data("world")

ggplot() +
  geom_polygon(data = world.map, aes(x = long, y = lat, group = group),
               fill = "#EEEECC") +
  geom_point(data = catalog, alpha = 0.25,
             aes(x = longitude, y = latitude, size = mag, colour = depth)) +
  labs(x = NULL, y = NULL) +
  scale_colour_gradient("Depth [m]", high = "red") +
  scale_size("Magnitude") +
  coord_fixed(ylim = c(-82.5, 87.5), xlim = c(-185, 185)) +
  theme_classic() +
  theme(
    axis.line = element_blank(), axis.text = element_blank(),
    axis.ticks = element_blank(),
    plot.margin=unit(c(3, 0, 0, 0),"mm"),
    legend.text = element_text(size = 6),
    legend.title = element_text(size = 8, face = "plain"),
    panel.background = element_rect(fill='#D6E7EF')
  )
The resulting plot gives the location of the earthquakes as points, with magnitudes indicated by the sizes of the points and depths given by their colour.
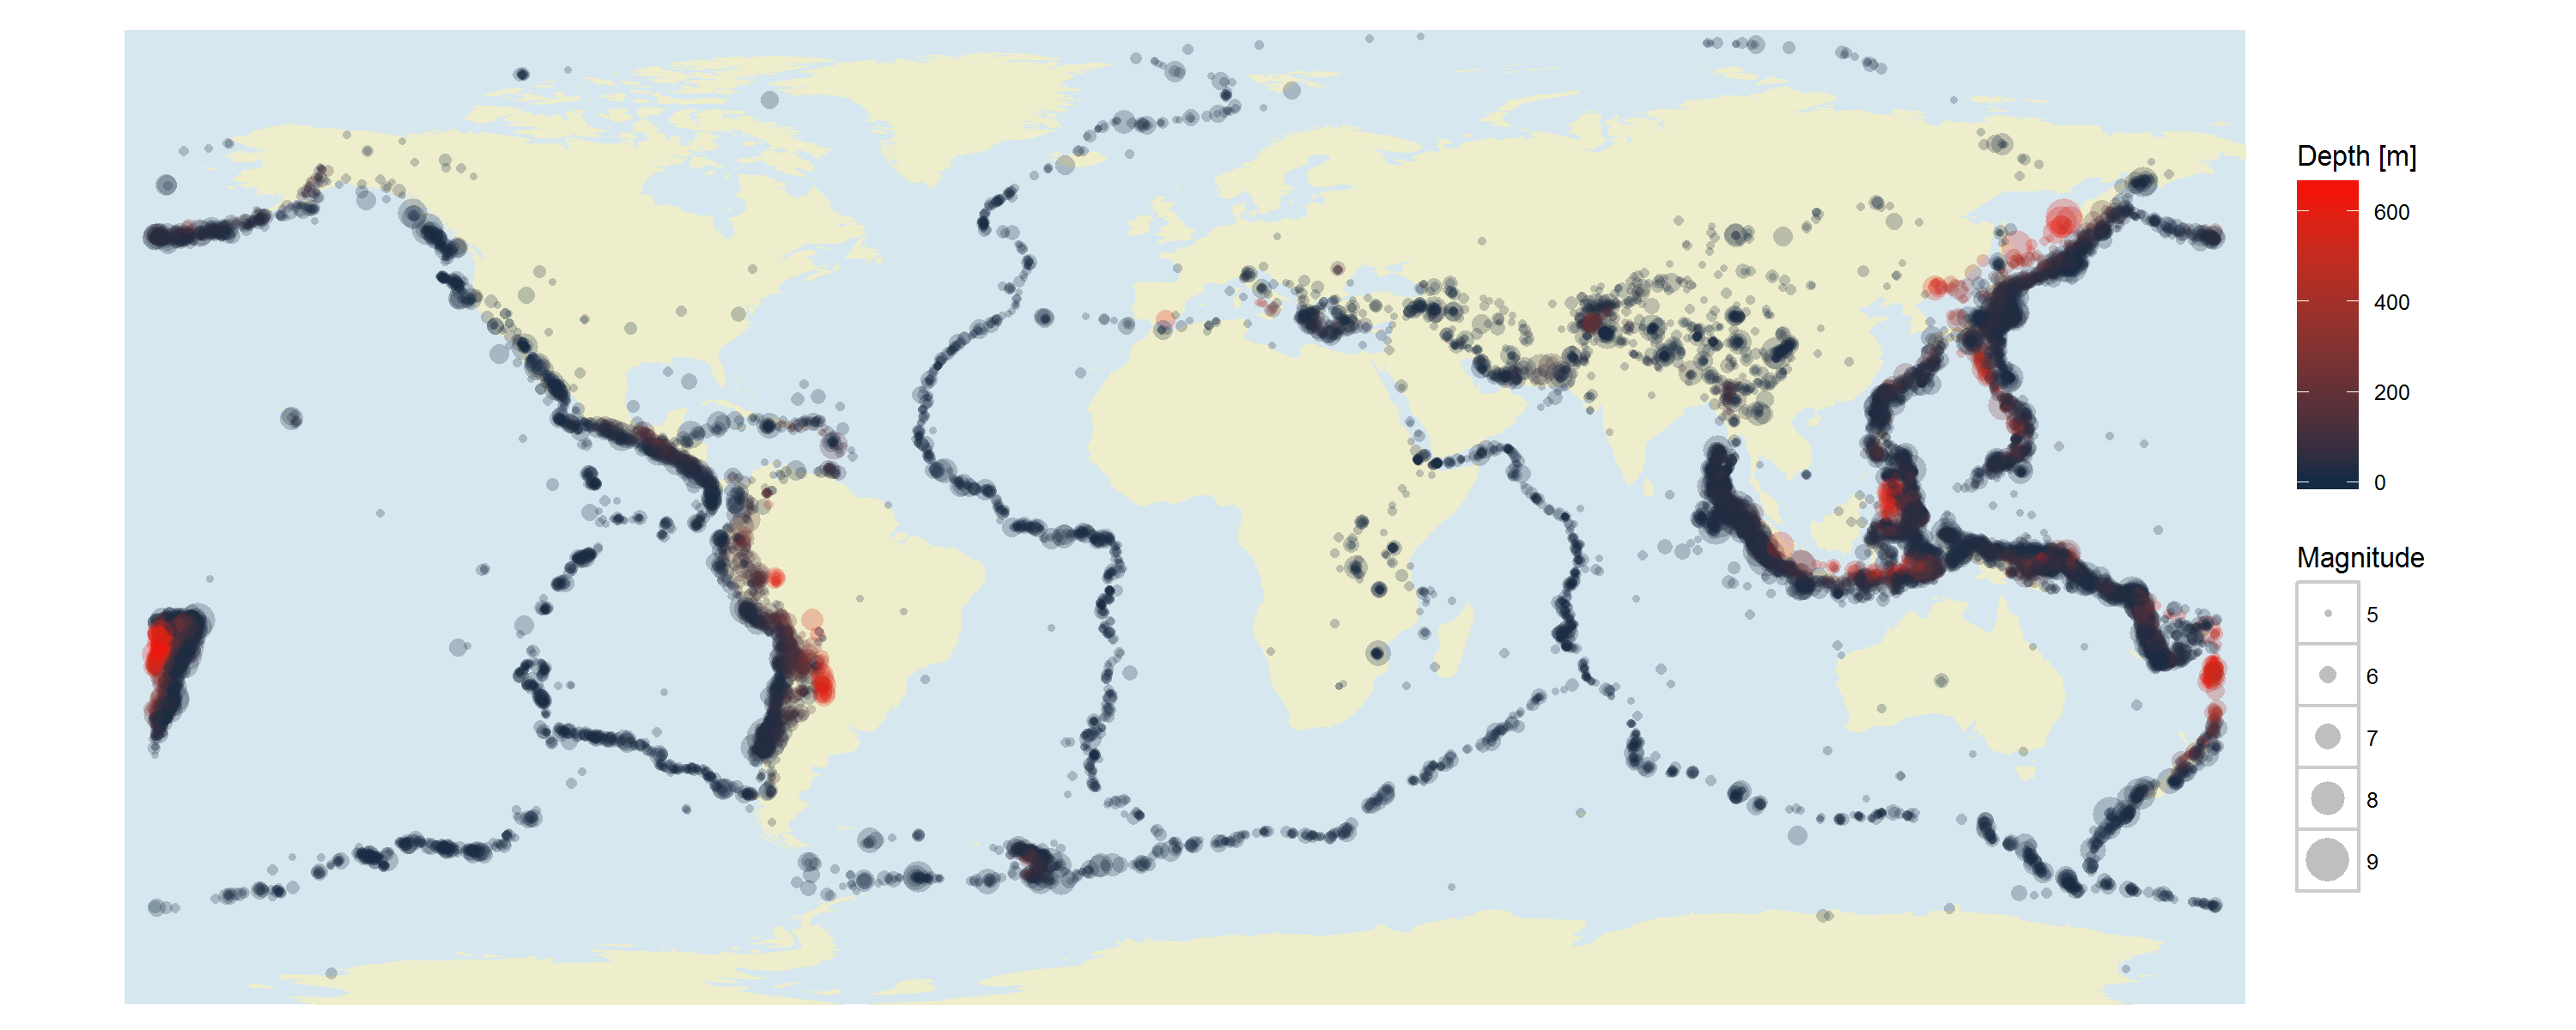
The Earth’s tectonic plates are well defined by the numerous inter-plate earthquakes, and there is a liberal sprinkling of intra-plate events as well.
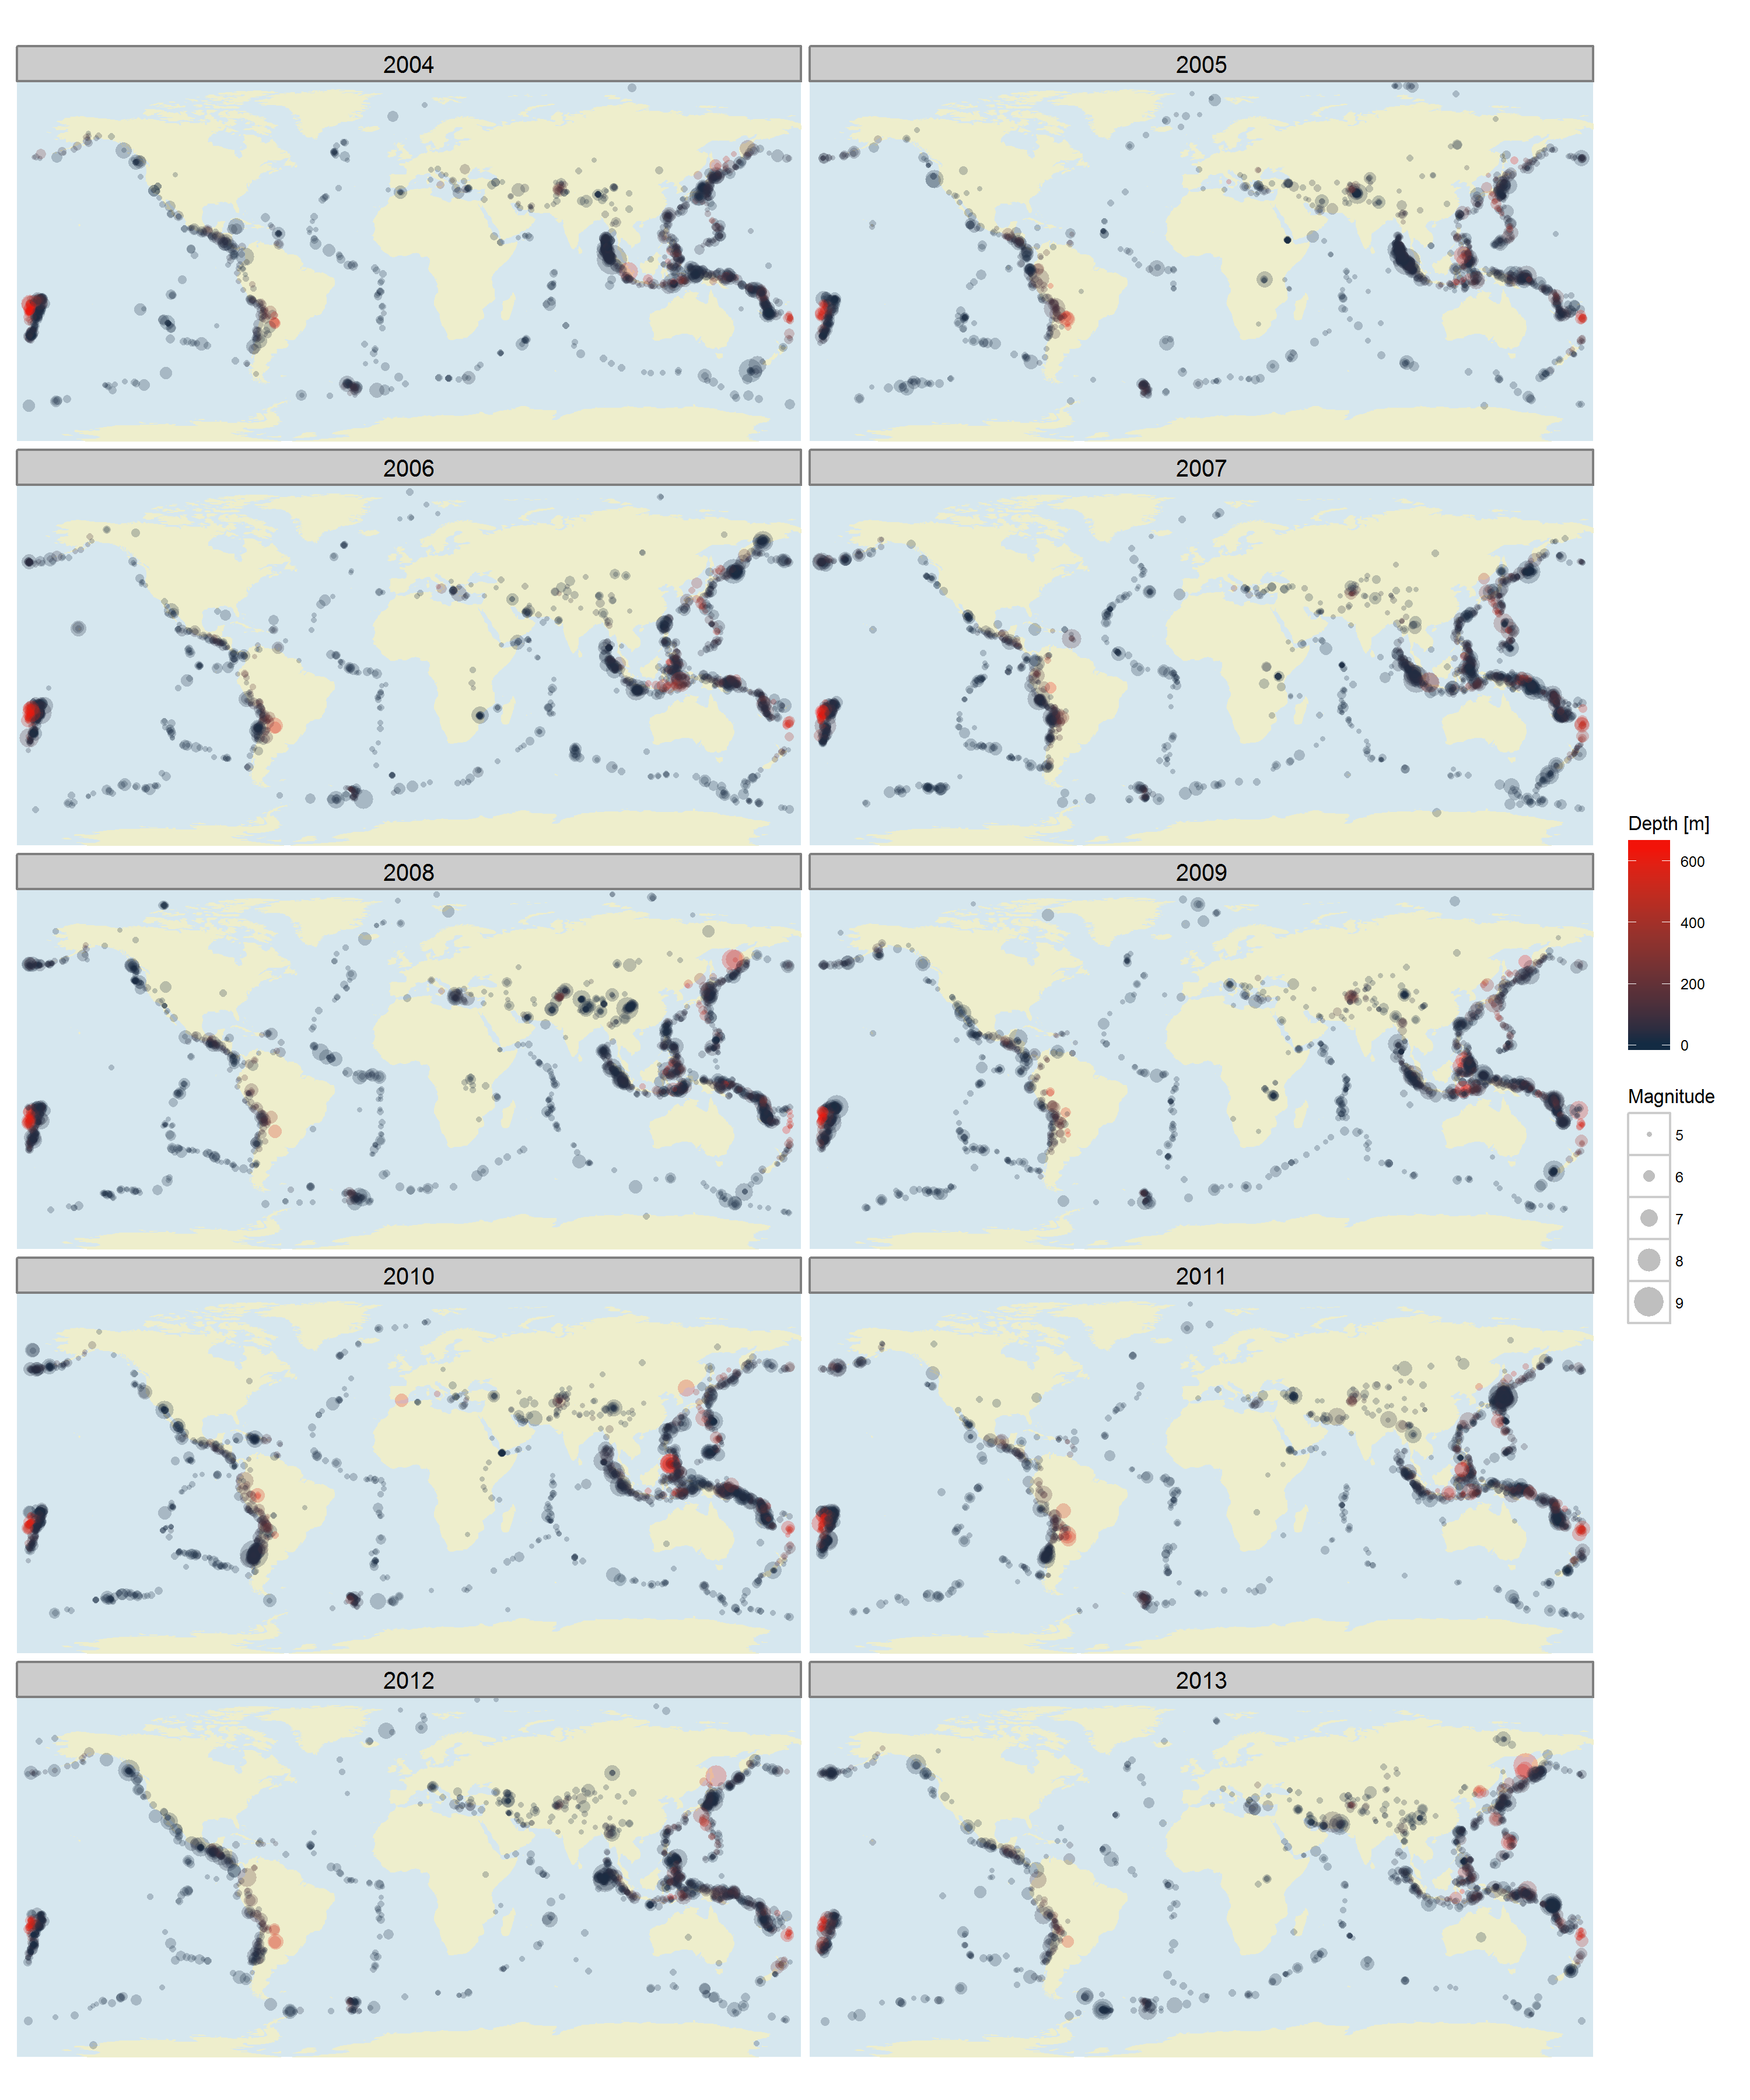
I made another chart showing the distribution of earthquakes broken down by year.
Distribution of Earthquake Magnitudes
While we are taking a high level look at the data, it’s interesting to see how the magnitudes are distributed. A logarithmic scale is necessary to make the frequencies visible over the full range of magnitudes.
ggplot(catalog, aes(x = mag)) +
  xlab("Magnitude") + ylab("Number of Earthquakes") +
  stat_bin(drop = TRUE, binwidth = 0.25) +
  scale_y_log10(breaks = c(1, 10, 100, 1000)) +
  theme_classic()
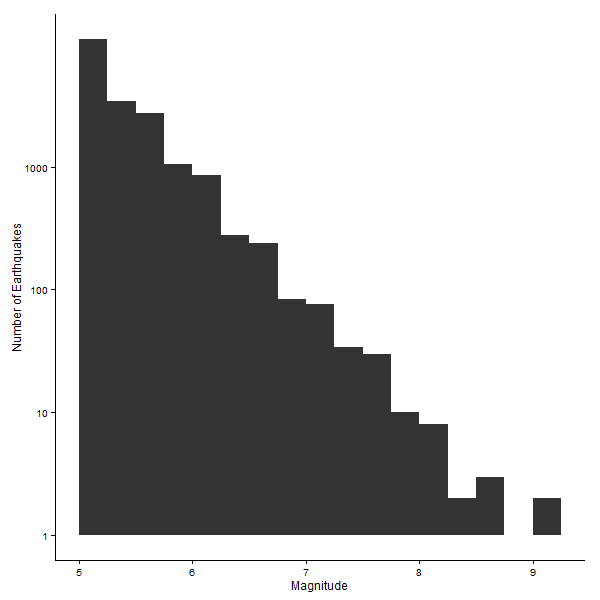
Very nice: consistent with a power law, as described by the Gutenberg–Richter law.