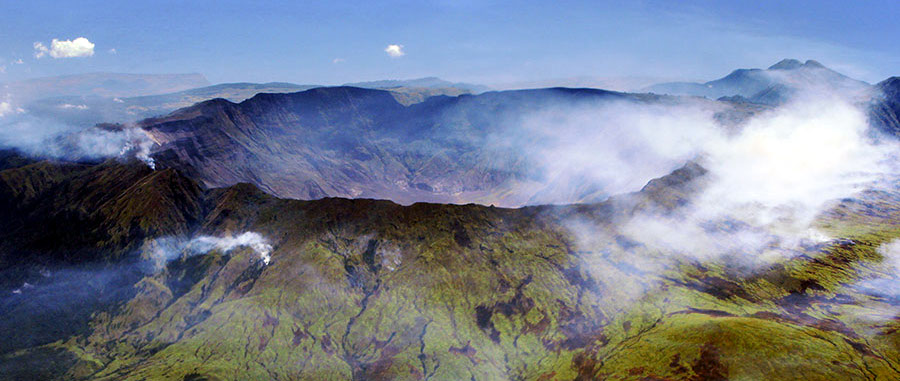
Around 199 years ago the largest volcano in recorded history, Mount Tambora, erupted, spewing an enormous volume of molten rock and ash into the atmosphere and onto the surrounding land.
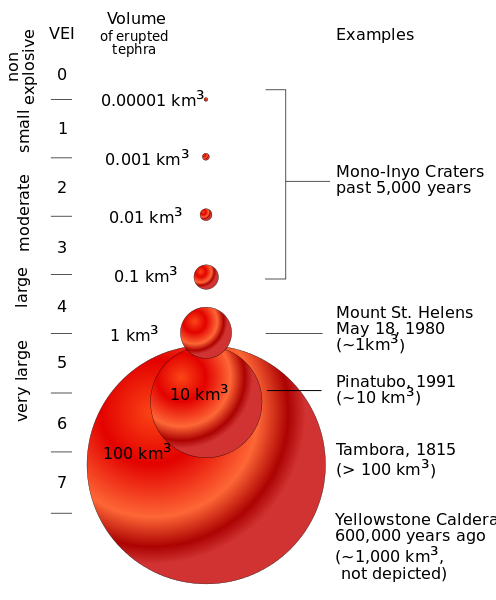
How is the intensity of a volcanic eruption quantified? Most people know about the Richter Scale which quantifies the energy released in an earthquake. The analogue for a volcanic eruption is the Volcanic Explosivity Index (VEI). This is a logarithmic scale ranging from 0 (non-explosive eruption) to 8 (largest volcano in history). Each ascending level indicates a tenfold increase in severity. The value of the index is determined by the ash cloud height, volume of lava and some qualitative observations. The schematic below (courtesy of Wikipedia) illustrates the interpretation of the index.
Data
Data on volcanoes and their eruptions were obtained from Smithsonian Institution Global Volcanism Program. The data came in two components: one detailing the volcanoes, the other giving the specifications of eruptions. Both were downloaded as xls files, which I converted to CSV to save space and also for quicker load times.
volcanoes <- read.csv(file.path("data", "GVP_Volcano_List.csv"), skip = 1)
eruptions <- read.csv(file.path("data", "GVP_Eruption_Results.csv"), skip = 1)
dim(volcanoes)
[1] 1550 12
dim(eruptions)
[1] 10762 22
Amongst the fields in the eruptions data is VEI, although there are numerous missing values.

```r
table(eruptions$VEI, useNA = "ifany")
   0    1    2    3    4    5    6    7 <NA>
 981 1271 3859 1103  492  176   51    7 2822
So, of the 10762 eruptions in the data, 2822 of them do not have a value for VEI.
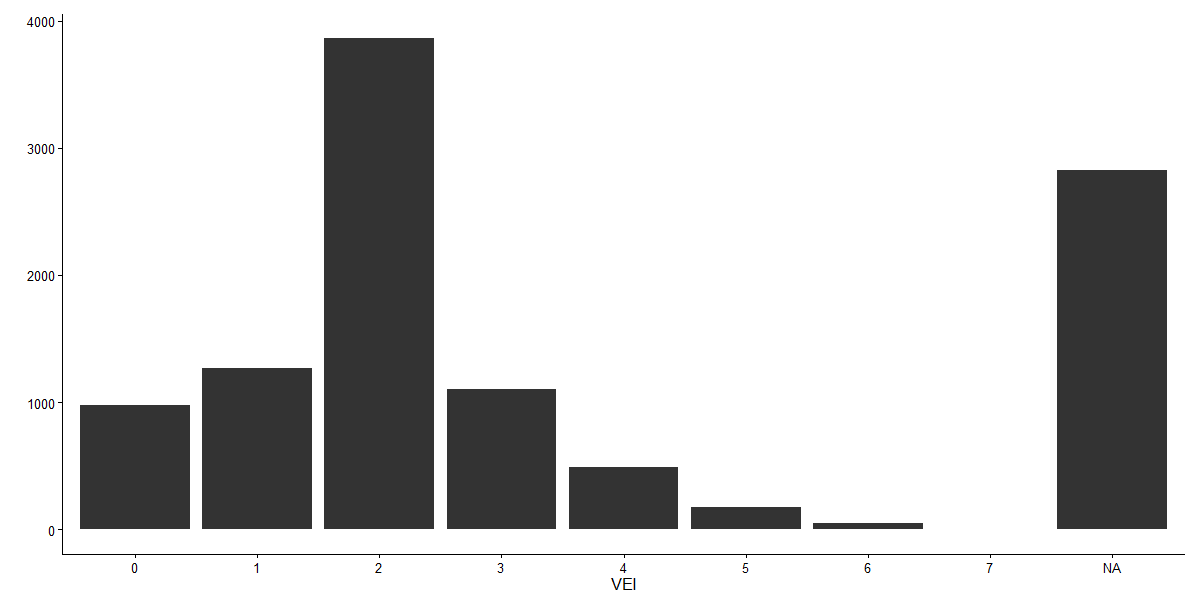
A quick histogram shows the distribution of VEIs.
library(ggplot2)

ggplot(eruptions, aes(x = VEI)) +
  geom_histogram() +
  ylab("") +
  theme_classic()
We see that the vast majority of eruptions have VEI of 2, which means that they eject between 0.001 and 0.01 km3 of ash and lava.
How frequently do volcanoes happen as a function of VEI? To get some decent statistics we will aggregate the data by century. The first thing we need to do is add a century column to the eruptions data. Then we count the number of eruptions at each VEI for every century spanned by the data.
eruptions$Century = ceiling(eruptions$Start.Year / 100)

library(plyr)

eruption.count = ddply(eruptions, .(VEI, Century), summarise, count = length(VEI))
#
eruption.count = subset(eruption.count, !is.na(VEI))

head(eruption.count)
  VEI Century count
1   0     -95     1
2   0     -90     1
3   0     -86     1
4   0     -85     2
5   0     -84     1
6   0     -83     2
tail(eruption.count)
    VEI Century count
527   7     -56     1
528   7     -43     1
529   7     -16     1
530   7      10     1
531   7      13     1
532   7      19     1
A tiled plot of counts versus VEI and century gives a good view on the data.
ggplot(eruption.count, aes(x = Century, y = VEI, fill = log10(count))) +
  geom_tile() +
  scale_fill_gradientn(
    colours = rev(rainbow(7)),
    labels = 10**(0:3)
  ) +
  scale_x_continuous(breaks = seq(-100, 20, 20)) +
  theme_classic() + theme(text = element_text(size = 16))
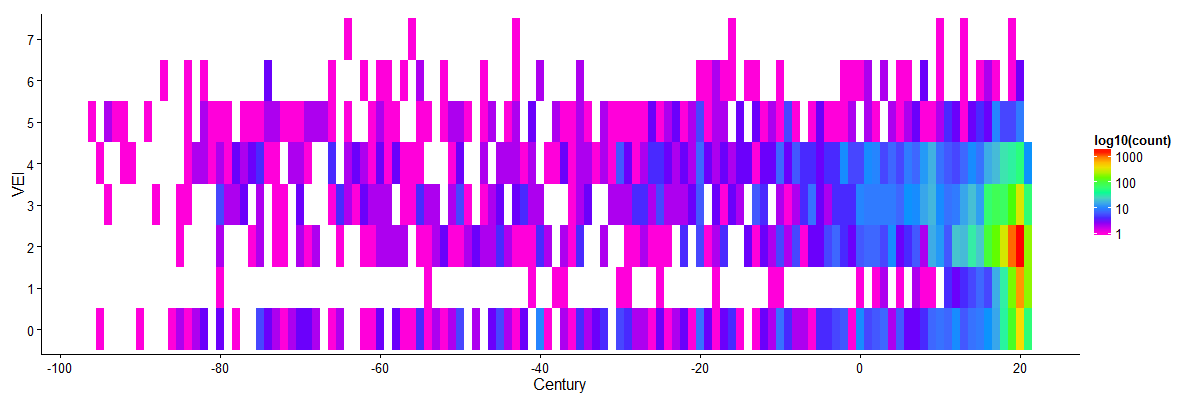
Now, it seems that eruptions have been becoming more frequent. Of course, this is not true: we have just become better at observing them. The data for the last century are pretty robust.
subset(eruption.count, Century == 20)
    VEI Century count
95    0      20   442
124   1      20   812
208   2      20  1634
296   3      20   333
394   4      20    53
486   5      20     9
525   6      20     3
We can see that there are just over 3000 eruptions with VEI of 3 or less, which corresponds to an average of around 30 per year. Eruptions with larger VEI are appreciably more rare.
Despite the somewhat perturbing frequency of these events, the majority of them happen in remote places. And they are probably remote because we wisely choose not to live too close to them!