Although I have been thinking vaguely about my Plan A goal of a Bill Rowan medal at the Comrades Marathon this year, I have not really put a rigorous pacing plan in place. I know from previous experience that I am likely to be quite a bit slower towards the end of the race. I also know that I am going to lose a few minutes at the start. How fast does this mean I need to run in order to get from Pietermaritzburg to Durban in under 9 hours?
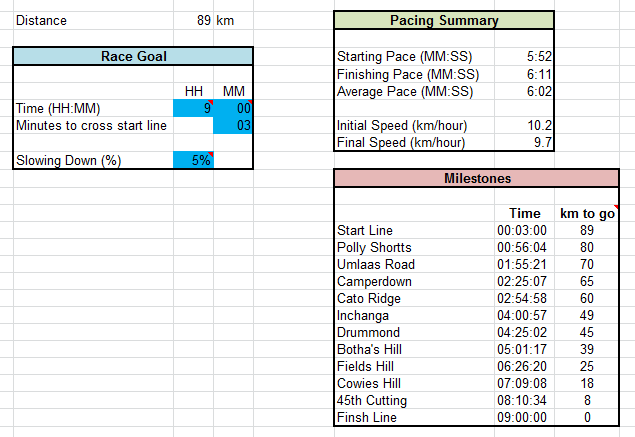
Well, suppose that it takes me 3 minutes from the gun to get across the starting line. And, furthermore, assume that I will be running around 5% slower towards the end of the race. To still get to Durban under 9 hours I would need to run at roughly 5:52 per km at the beginning and gradually ease back to about 6:11 per km towards the end.
I arrived at these figures using a pacing spreadsheet. To get an idea of your pace requirements you will need to specify your goal time, the number of minutes you anticipate losing before crossing the start line and an estimate of how much you think you will slow down during the course of the race. This is done by editing the blue fields indicated in the image below. The rest of the spreadsheet will update on the basis of your selections.
The spreadsheet uses a simple linear model which assumes that your pace will gradually decline at the rate you have specified. If you give 0% for your slowing down percentage then the calculations are performed on the basis of a uniform pace throughout the race. Of course, neither the linear model nor a uniform pace are truly realistic. We all know that our pace will vary continuously throughout the race as a function of congestion, topography, hydration, fatigue, motivation and all of the other factors which come into play. However, as noted by the eminent statistician George Box “all models are wrong, but some are useful”. In this case the linear model is a useful way to account for the effects of fatigue.
The spreadsheet will give you an indication of the splits (both relative to the start of the race as well as time of day) and pace (instantaneous and average) required to achieve your goal time. It also contains a pair of charts which will be updated with your projected timing and pace information.
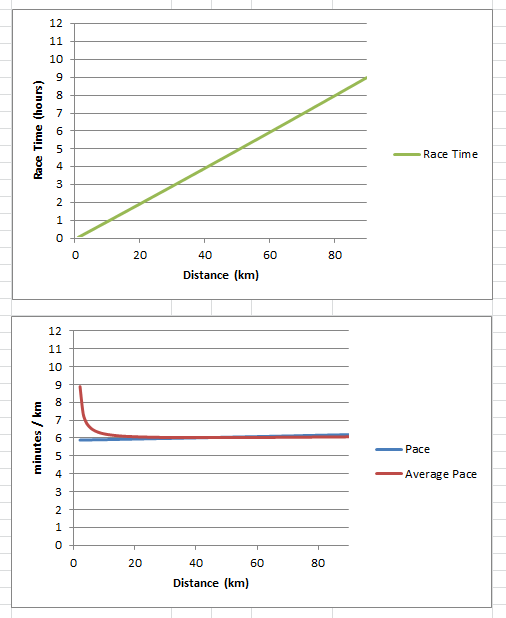
My plan on race day is to run according to my average pace. This works well because it smooths out all the perturbations associated with tables and walking breaks.
Losing Time at the Start
One interesting thing to play around with on the spreadsheet is the effect of losing time at the start. If you vary this number you should see that it really does not have a massive influence on your pacing requirements for the rest of the race. For example, if I change my estimate from 3 minutes to 10 minutes then my required average pace decreases from 6:02 per km to 5:57 per km. Sure, this amounts to 5 seconds shaved off every km, but it is not unmanageable: the delay at the start gets averaged out over the rest of the race.
Naturally, the faster you are hoping to finish the race, the more significant a delay at the start is going to become. However, if you are aiming for a really fast time then presumably you are in a good seeding batch. For the majority of runners it is probably not going to make an enormous difference and so it is not worth stressing about.
The important thing is to make sure that you just keep on moving forward. Don’t stop. Just keep on putting one foot in front of the other.
Other Pacing Charts
The pacing chart by Dirk Cloete is based on the profile of the route. It breaks the route down into undulating, up and down sections and takes this into account when calculating splits.