With the circlize package, putting together a Chord Diagram is simple.
library(circlize)
library(RColorBrewer)
# Create a random adjacency matrix
#
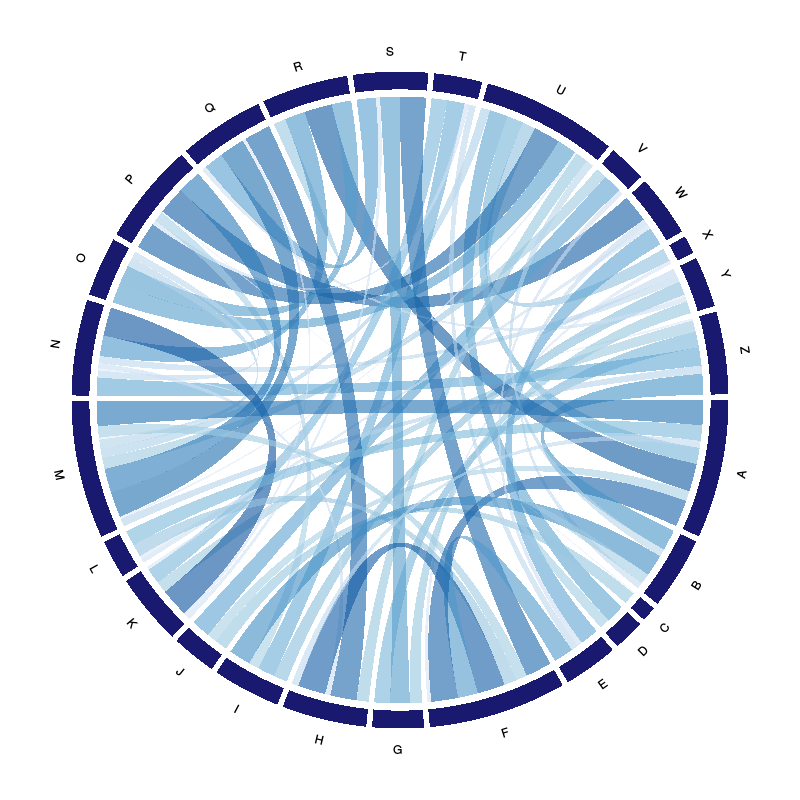
adj = matrix(sample(c(1, 0), 26**2, replace = TRUE, prob = c(1, 9)),
nrow = 26, dimnames = list(LETTERS, LETTERS))
adj = ifelse(adj == 1, runif(26**2), 0)
chordDiagram(adj, transparency = 0.4, grid.col = "midnightblue",
col = colorRamp2(seq(0, 1, 0.2), brewer.pal(6, "Blues")))