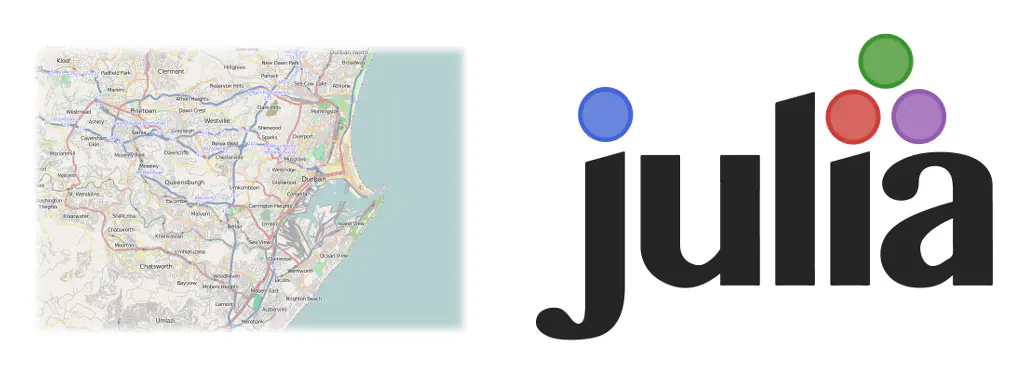
A lot of my data reflects events happening at different geographic locations (and, incidentally, at different times, but that’s another story). It’s not surprising that I’m interested in mapping those data. Julia has an OpenStreetMap package which presents an interface to the OpenStreetMap service. The package is well documented and has an extensive range of functionality. As with a number of previous posts in this series, I’m just going to skim the surface of what’s available.
We’ll need to load up the Requests package to retrieve the map data and the OpenStreetMap package to manipulate and process those data.
using Requests
using OpenStreetMap
As far as I can see the OpenStreetMap package doesn’t implement functionality for downloading the map data. We do this directly through an HTTP request. We’ll specify a map area by giving the latitude and longitude of the bottom-left and top-right corners.
const MAPFILE = "map.osm";
minLon = 30.8821;
maxLon = minLon + 0.05;
minLat = -29.8429;
maxLat = minLat + 0.05;
We then build the query URL using Julia’s convenient string interpolation and execute a GET request against the OpenStreetMap API.
URL = "http://overpass-api.de/api/map?bbox=$(minLon),$(minLat),$(maxLon),$(maxLat)"
"http://overpass-api.de/api/map?bbox=30.8821,-29.8429,30.932100000000002,-29.7929"
osm = get(URL)
Response(200 OK, 10 headers, 1958494 bytes in body)
save(osm, MAPFILE)
"map.osm"
Save the resulting data (it’s just a large blob of XML) to a file. Feel free to open this file in an editor and browse around. Although there is currently no official schema for the OpenStreetMap XML, the documentation gives a solid overview of the format.
file map.osm
map.osm: OpenStreetMap XML data
We process the contents of the XML file using getOSMData().
nodes, highways, buildings, features = getOSMData(MAPFILE);
println("Number of nodes: $(length(nodes))")
Number of nodes: 9360
println("Number of highways: $(length(highways))")
Number of highways: 592
println("Number of buildings: $(length(buildings))")
Number of buildings: 5
println("Number of features: $(length(features))")
Number of features: 12
The call to getOSMData() returns all of the data required to build a map. Amongst these you’ll find a dictionary of features broken down by :class, :detail and :name. It’s always handy to know where the nearest Woolworths is, and this area has two of them.
features
Dict{Int64,OpenStreetMap.Feature} with 12 entries:
  1871785198 => OpenStreetMap.Feature("amenity","pharmacy","Clicks")
  270909308 => OpenStreetMap.Feature("amenity","fuel","BP")
  1932067048 => OpenStreetMap.Feature("shop","supermarket","Spar")
  747740685 => OpenStreetMap.Feature("shop","supermarket","Westville mall")
  3011871215 => OpenStreetMap.Feature("amenity","restaurant","Lupa")
  1871785313 => OpenStreetMap.Feature("shop","clothes","Woolworths")
  1871785167 => OpenStreetMap.Feature("shop","supermarket","Checkers")
  747740690 => OpenStreetMap.Feature("amenity","school","Westville Girl's High")
  1872497461 => OpenStreetMap.Feature("shop","supermarket","Pick n Pay")
  1554106907 => OpenStreetMap.Feature("amenity","pub","Waxy O'Conner's")
  1872497555 => OpenStreetMap.Feature("shop","supermarket","Woolworths")
  1932067047 => OpenStreetMap.Feature("amenity","bank","Standard Bank")
fieldnames(OpenStreetMap.Feature)
3-element Array{Symbol,1}:
 :class
 :detail
 :name
Other dictionaries list the highways and buildings in the area.
Although we specified the latitudinal and longitudinal extremes of the map originally, we can retrieve these wrapped up in a data structure. Note that these values are given in Latitude-Longitude-Altitude (LLA) coordinates. There’s functionality for transforming to other coordinate systems like East-North-Up (ENU).
bounds = getBounds(parseMapXML(MAPFILE))
Geodesy.Bounds{Geodesy.LLA}(-29.8429,-29.7929,30.8821,30.9321)
We’re ready to take a look at the map using plotMap().
const WIDTH = 800;
plotMap(nodes,
        highways = highways,
        buildings = buildings,
        features = features,
        bounds = bounds,
        width = WIDTH,
        roadways = roads)
And here’s what it looks like. You can further customise the look and feel of the map if necessary.

Plotting maps is just the beginning. You can use findIntersections() to find highway intersections; generate a transportation network using createGraph(); and find the shortest and fastest routes between locations using shortestRoute() and fastestRoute(). The package is literally a trove of cool and useful things.
There might be interesting synergies between this package and the GeoInterface, GeoIP, GeoJSON and Geodesy packages. Those will have to wait for another day. But feel free to experiment in the meantime!