In light of recent developments, a bit of work that I did almost two years ago has become rather relevant.
In a chapter of Freakonomics entitled “Would a Roshanda by Any Other Name Smell as Sweet?”, Steven Levitt and Stephen Dubner consider the influence a given name can have on a child’s future, from their performance at school to career opportunities and beyond. Many parents believe that the name they choose for their child will have a significant effect on their future, and there is certainly data to support this idea. However, there is also evidence to the contrary. Levitt and Dubner cite the real example of two brothers named Winner and Loser. Loser turned out to be a success, while Winner was appreciably less fortunate. It is probably reasonable to conclude that a given name is only one of many factors contributing to a child’s destiny!
Levitt and Dubner further speculate that the name chosen for a child reflects more on the parents (specifically their care, intentions and status), and that it is these factors, rather than the name, which will have a greater influence on the upbringing of a child, and hence his or her future. Although there may be a correlation between names and destiny, there is probably no direct causal link.
Levitt and Dubner also considered the distinctive naming patterns among black and white Americans, presenting some intriguing results. But that’s a story for another day. In this series of three articles I will look in detail at the evolution over time of given name usage in the United States. The analyses will be based on data compiled by the Social Security Administration extending from 1880 to the present day. These data are essentially complete but, in the interests of privacy, exclude those names which have fewer than 5 occurrences.
We will start by taking a high-level look at the number of given names. At the end of the nineteenth century there were only around 4000 different given names in use around the United States. By 2012 this number had escalated to more than 33 000. The plots below show how the number of given names has changed with time. The trend towards greater variety is readily apparent. However, this trend is by no means uniform. There was a dramatic increase around the outbreak of World War I, followed by a decade (roughly 1920 to 1930) during which the number of names being used actually declined. After that there has been a steady increase in the number of names, reaching a peak in 2008 when 20 430 and 14 598 different names were given to girls and boys respectively. Since then there has been a steady decline in name diversity.
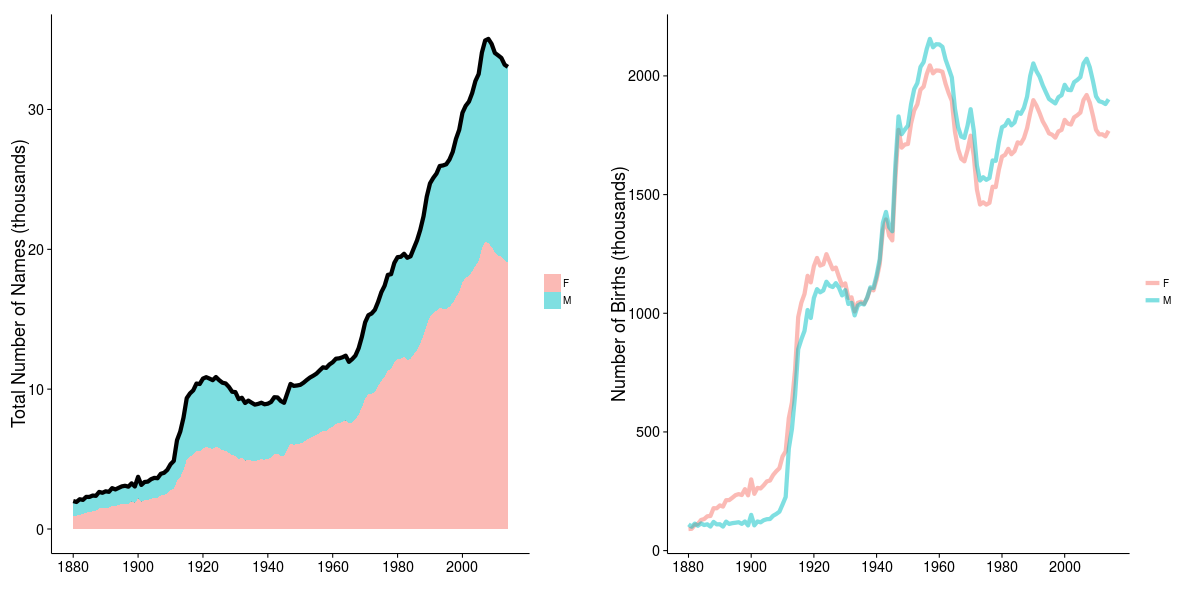
If one compares the number of names (left panel) to the number of births (right panel), then something interesting emerges: the explosion of names around World War I is mirrored by a sudden increase in the number of births. However, the next peak in births, following the end of World War II, was not accompanied by a significant increase in the variety of names. Possibly these “Baby Boomers” were more or less satisfied with the range of names already in use.
Note that the number of births could be placed in a different context by normalizing to the size of the population. This would give the per capita birth rate. However, for the purpose of comparison with the number of names, the absolute number of births is a more meaningful statistic.
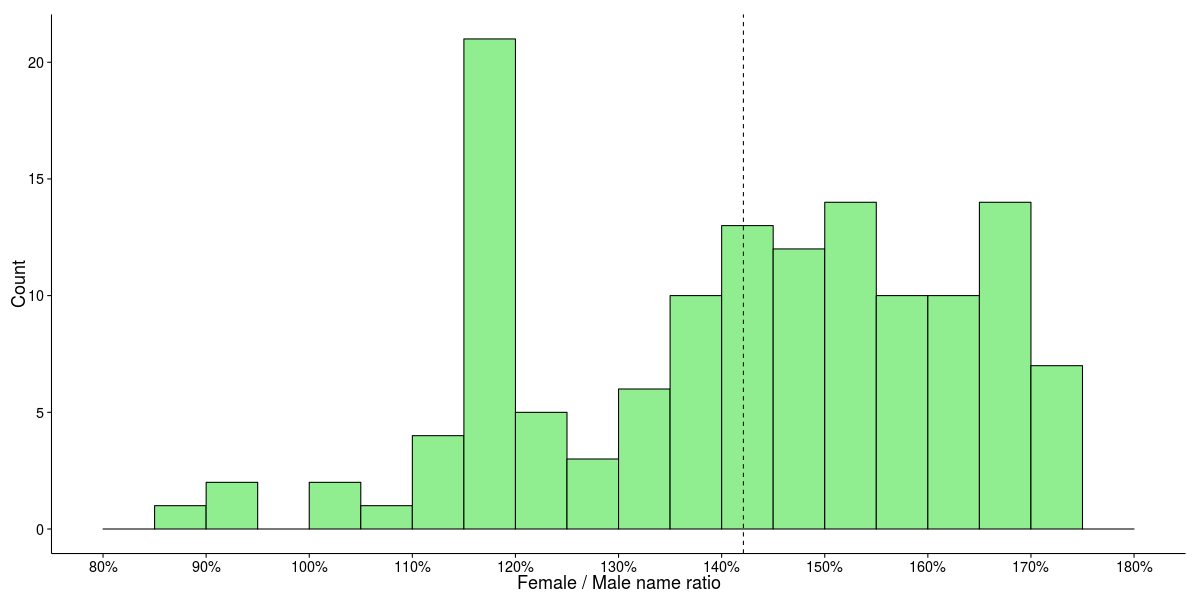
Interestingly, there is almost always a greater variety of girls’ names. The histogram below shows the distribution of the ratio of girls’ names to boys’ names calculated on an annual basis. It is clear that for only a handful of years have a greater variety of names been assigned to boys than girls. On average (dashed vertical line) there are 42% more girls’ names in use.
Is it reasonable to assume that these patterns apply uniformly across the entire United States? Let’s have a look. If we break the number of names in use down according to state then the data look like this:
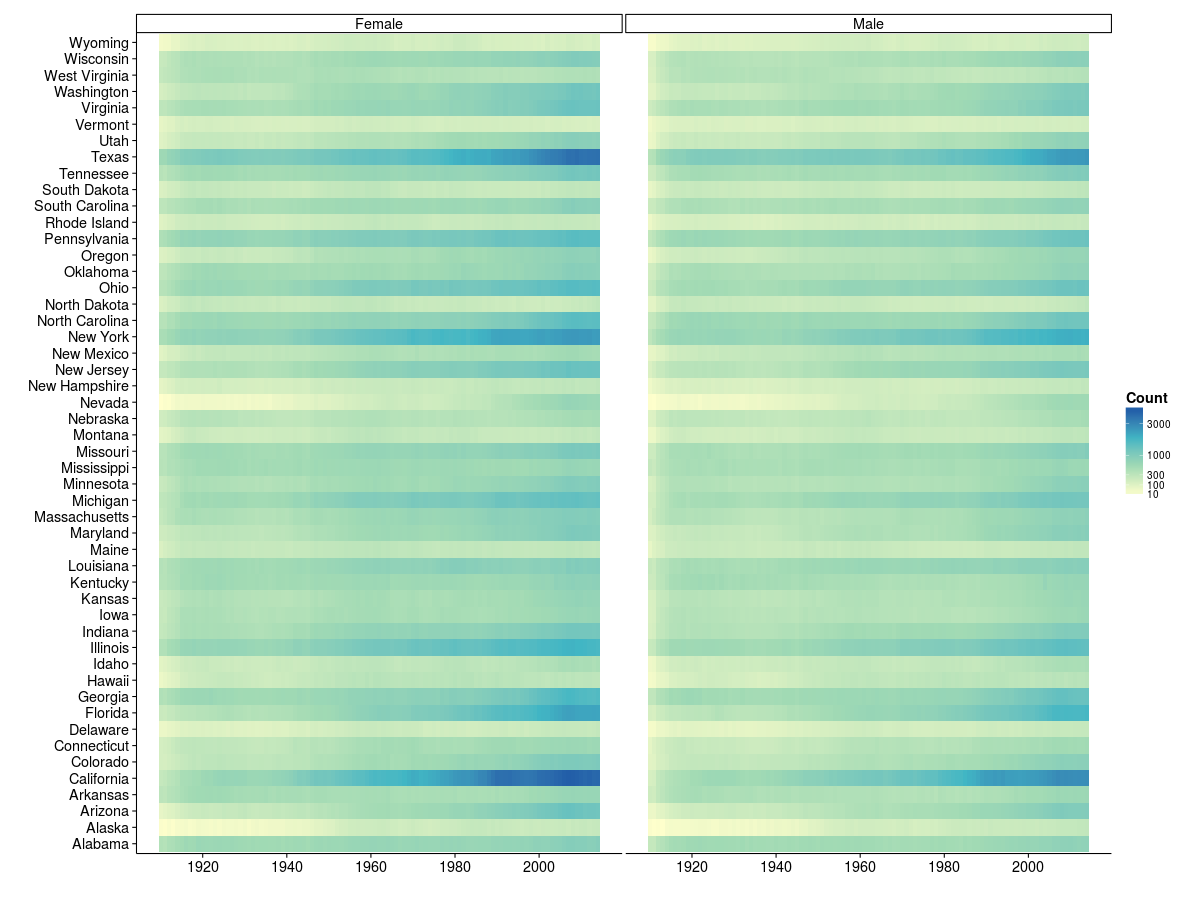
The upward trend in the variety of names seems to be driven by only a few states. California, Texas and New York make the largest contributions to the growth. Some states, like Alabama, North Dakota and Wyoming, have experienced very little growth at all. Interestingly, these states are among the most conservative states according to a survey by Gallup. That makes some sense: they are probably rather concerned about tradition and preserving their heritage. However, the converse does not appear to hold: the states with the most rapid growth in names are not high on the liberal end of the spectrum. Ideology is evidently not the only factor fueling the growth in names.
The gender ratio has also evolved dramatically over time. The choropleth below shows the ratio of girls’ names to boys’ names for each of the continental states. Click here to see how this has changed over time.
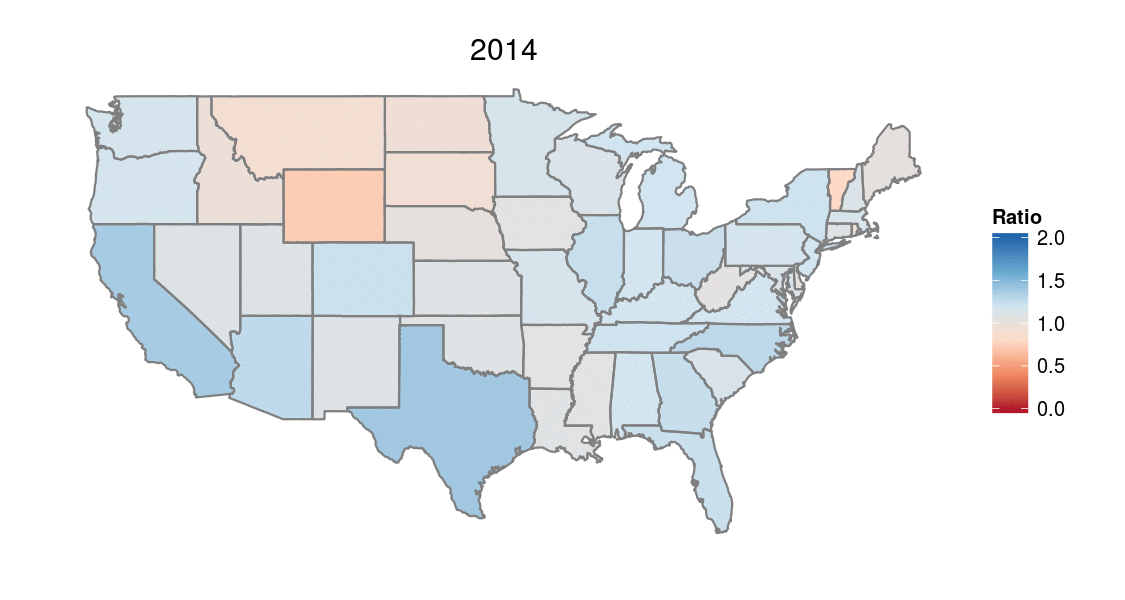
Nevada is the most dynamic, with the balance swinging regularly back and forth between the genders. The number of girls’ names is consistently dominant across most states for an extended period between around 1950 and 1990. After this, boys’ names gain the ascendancy is some states. This is particularly evident in North and South Dakota, Idaho, Montana and Wyoming. California and Texas, in addition to having an enormous range of names, also appear to use a far greater variety of girls’ names.
Each generation wants new symbols, new people, new names. They want to divorce themselves from their predecessors. Jim Morrison
It’s conceivable that some states are more eager to separate themselves from the past. By using new names, freshly invented or co-opted from elsewhere, they are hoping that each new generation will be different from the last. Other states are quite happy for the pool of given names to remain more or less the same. Perhaps they were happier with the last generation?
This analysis has not taken into account the influence of nicknames and derivative names. Is it possible that the excess of girls’ names is caused by the adoption of cute variations of existing names? These issues will be considered later in the series, in addition to examining the prevalence of names used across both genders.