I put together this example to illustrate some general R programming principles for my Data Science class at iXperience. The idea is to use Buffon’s Needle to generate a stochastic estimate for pi.
#' Exploit symmetry to limit range of centre position and angle.
#'
#' @param l needle length.
#' @param t line spacing.
#'
buffon <- function(l, t) {
	# Sample the location of the needle's centre.
	#
	x <- runif(1, min = 0, max = t / 2)
	#
	# Sample angle of needle with respect to lines.
	#
	theta = runif(1, 0, pi / 2)
	#
	# Does the needle cross a line?
	#
	x <= l / 2 * sin(theta)
}

L = 1
T = 2
#
N = 10000
#
cross = replicate(N, buffon(L, T))

library(dplyr)
#
estimates = data.frame(
	n = 1:N,
	pi = 2 \* L / T / cumsum(cross) \* (1:N)
) %>% subset(is.finite(pi))
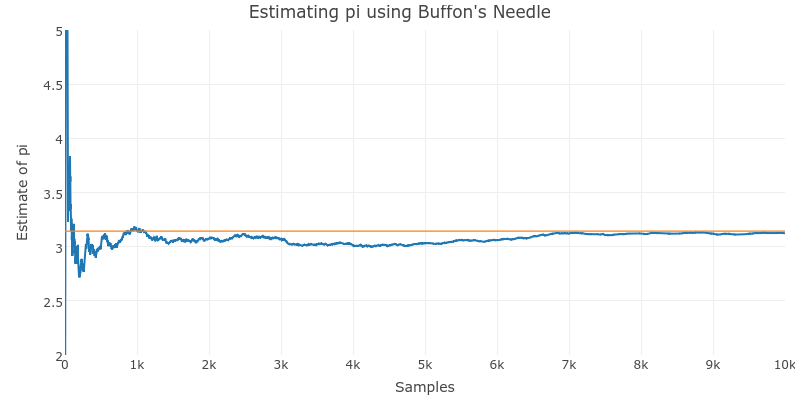
Here are the results (click on the image for an interactive version). The orange line is the reference value and the blue line represents the results of the computation.