Most Probable Birth Month
In a previous post I showed that the data from www.baseball-reference.com support Malcolm Gladwell’s contention that more professional baseball players are born in August than any other month. Although this might be explained by the 31 July cutoff for admission to baseball leagues, it was suggested that it could also be linked to a larger proportion of babies being born in August.
In order to explore this idea I gathered data from https://www.cdc.gov/ for births in the USA between 1994 and 2014. These data as well as the baseball data have been published as a R package here. Install using
devtools::install_github("datawookie/lifespan")
library(lifespan)
Let’s explore the hypothesis regarding non-uniform birth months.
library(dplyr)
group_by(births, month) %>% summarise(count = sum(count))
Source: local data frame [12 x 2]
month count
(fctr) (int)
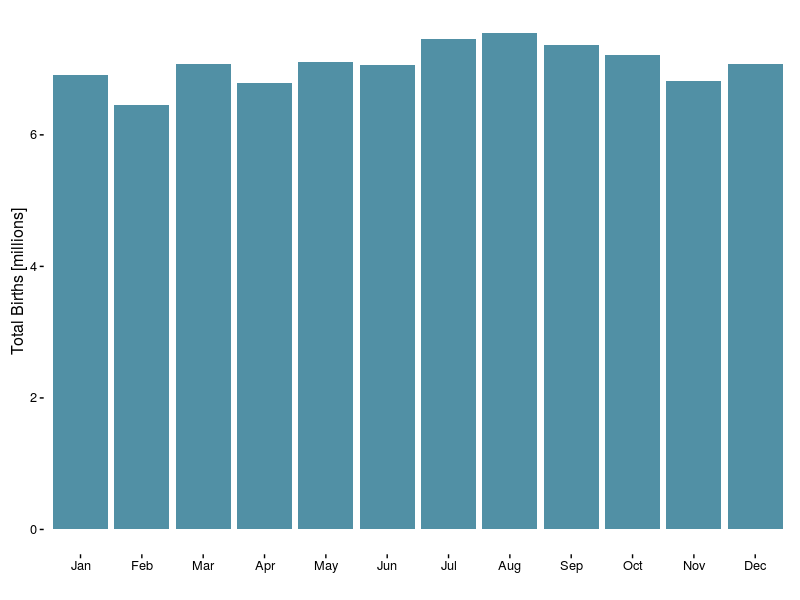
1 Jan 6906798
2 Feb 6448725
3 Mar 7080880
4 Apr 6788266
5 May 7112239
6 Jun 7059986
7 Jul 7461489
8 Aug 7552007
9 Sep 7365904
10 Oct 7220646
11 Nov 6813037
12 Dec 7079453There is definitely significant non-uniformity:
chisq.test(.Last.value$count, p = c(31, 28.25, 31, 30, 31, 30, 31, 31, 30, 31, 30, 31),
             rescale.p = TRUE)
Chi-squared test for given probabilities
data: .Last.value$count
X-squared = 77600, df = 11, p-value <2e-16We can dig into that a little deeper and see the total number of births between 1994 and 2014 broken down by month. The aggregate for August is certainly higher than any other month, but only marginally larger than that for July.
Delving still deeper we find that the monthly counts exhibit significant variation from year to year and that August has some appreciable outliers.

Specifically, August in 2006 and 2007 appear to have been bumper births months. Interesting!
group_by(births, year, month) %>% summarise(count = sum(count)) %>% ungroup() %>%
  arrange(desc(count))
Source: local data frame [252 x 3]
year month count
(int) (fctr) (int)
1 2007 Aug 391117
2 2006 Aug 388481
3 2007 Jul 380356
4 2008 Jul 376105
5 2006 Sep 375389
6 2008 Aug 374028
7 2007 Oct 370069
8 2005 Aug 370045
9 2009 Jul 369117
10 2008 Sep 368660
.. ... ... ...Of course, a peak in overall births in August does not mean that there’s a direct causative link to the peak in professional baseball players’ births. But the contribution cannot be ignored.