Comrades Marathon (2019) Splits
I’m looking at ways to effectively visualise the splits data for the 2019 edition of the Comrades Marathon. My objectives are to provide:
- an overall view of the splits across the entire field and
- a detailed view for individual runners (relative to the rest of the field).
Ridge Plot
My working solution for visualising the global splits data is a ridgeline plot created with the {ggridges} package.

The density curve for each of the splits gives the distribution of the runners in time at that point. Quartiles are displayed as vertical lines.
It’s immediately apparent how the field spreads out between the first mat at the base of Cowie’s Hill (Pinetown) and the finish line in Pietermaritzburg. Whereas the distribution is fairly smooth early in the race, structure starts to emerge as you get closer to the finish, showing runners who are aiming for specific finishing times (under 9, 10, 11 or 12 hours).
Split Plots
I experimented with various options for displaying the splits of specific runners. It’s simple enough to just show their individual splits, but I wanted to juxtapose this information against the rest of the field. This is what I came up with. I’m calling it a “splits plot” for the moment.
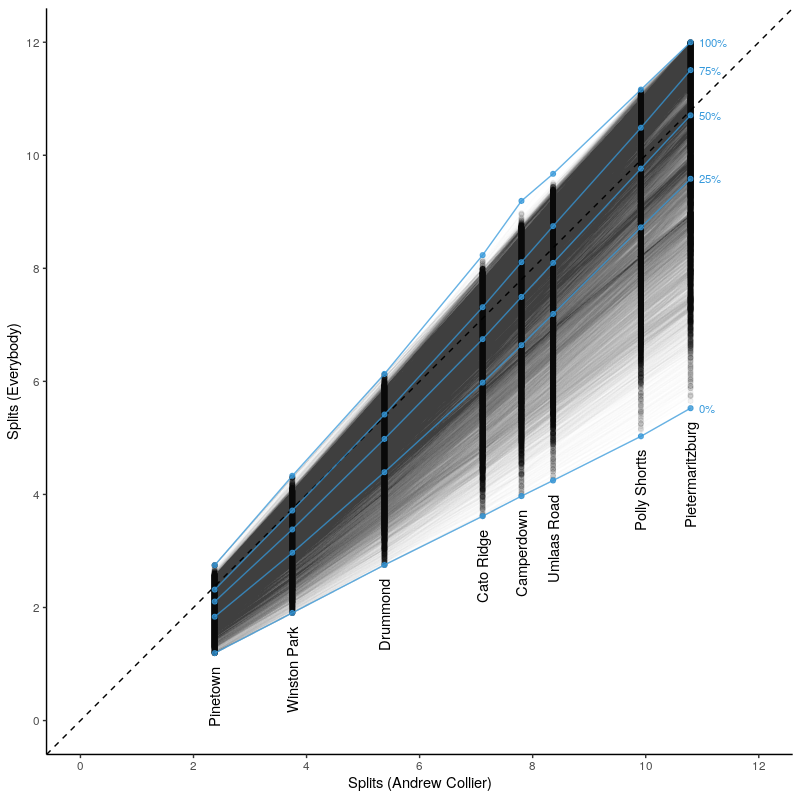
On the x-axis are the split times for a specific “focus” runner, while on the y-axis are the split times for the rest of the field. Points are plotted and linked by (partially transparent) lines for every finisher. The diagonal dashed line indicates runners who had the same splits as the focus runner, with those above the dashed line being slower and those below being faster. The quartiles on each of the splits are shown in blue, making it possible to easily see whether a runner is getting better or worse (relative to the rest of the field) as the race progresses. The plot indicates that I got off to a relatively slow start (just outside the 75th percentile in Pinetown) but gathered ground over the hills of Natal (finishing slightly beyond the median).
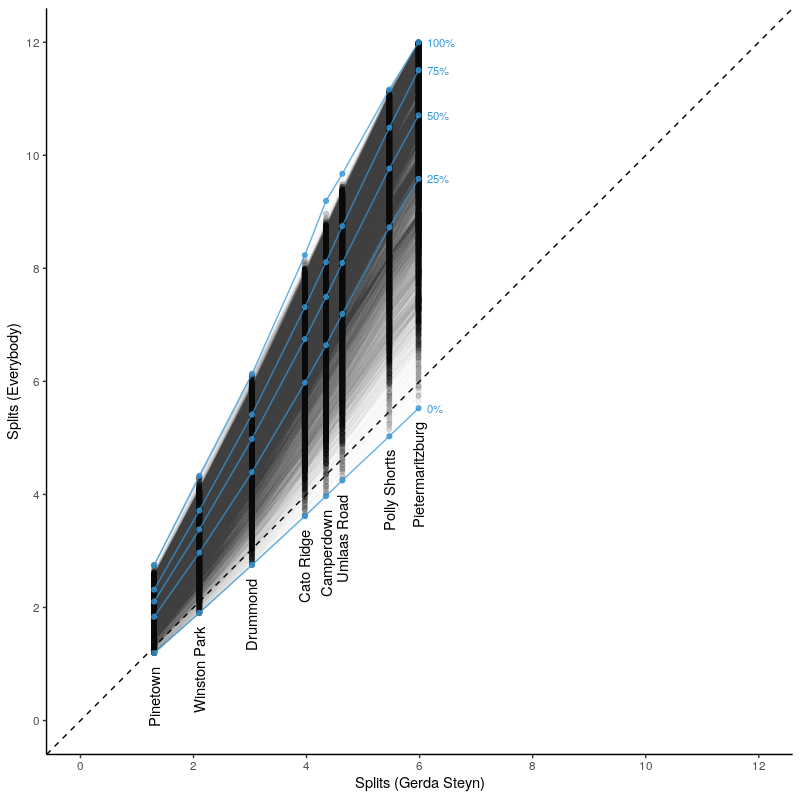
Here’s what that looks like for a quality athlete:
Analysis and visualisation using R.