Durban EDGE DataQuest
The Durban EDGE (Economic Development and Growth in eThekwini) DataQuest was held at UKZN (Westville Campus) on 13 November 2019. Participants were tasked with creating something interesting and useful with the civic data on the new Durban EDGE Open Data Portal developed by Open Data Durban.
These datasets were available:
- eThekwini Water and Sanitation
- Durban Skills Audit 2016
- eThekwini Financial Statistics Survey
- eThekwini Rate Collection and Valuation Roll
- eThekwini Business Licensing
- eThekwini DMOSS -DURBAN Metropolitan Open Space System
- Rentable Office Data
- eThekwini Labour Force
- eThekwini Building Plans
- Durban Film Sector Data
- KZN Formal Education - Current
- eThekwini Electricity Usage and Access and
- eThekwini Ward Maps.

None of the participants had prior experience with R, but most had used Excel. I’d hoped to get at least a few of them to try using R. To make this more accessible I introduced them to RStudio Cloud, which is such a phenomenal tool for this sort of gig since it requires zero setup on the participants’ machines. I also put together a couple of starter scripts:
Let’s take a quick look at them.
Electricity Usage
This script loads the electricity consumption data, does some simple wrangling (mostly just fixing the year column) and then creates a few plots.
The first plot shows how the number of (formal) electricity consumers has increased over time.
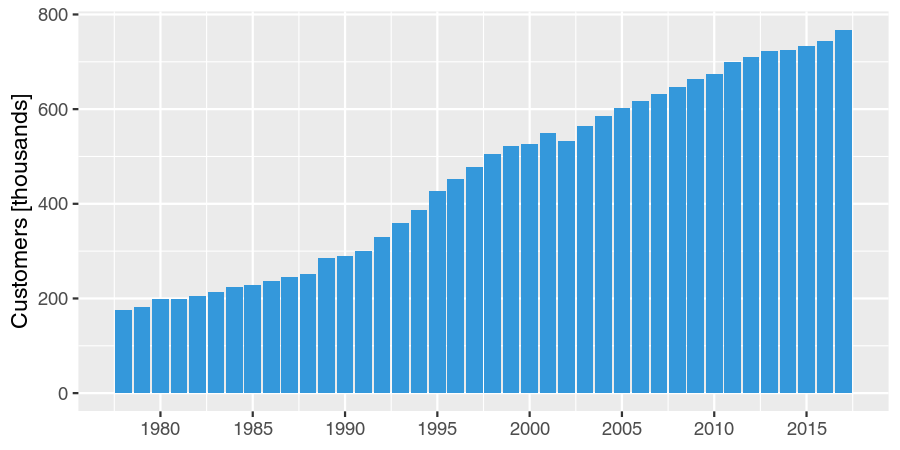
We see that there is a systematic increase in the number of consumers, which makes sense in terms of population growth and urbanisation.
How much energy is being consumed?
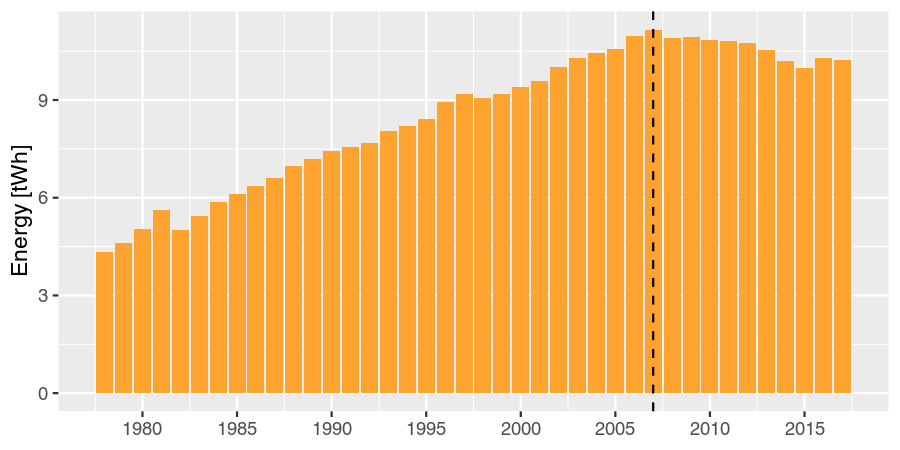
Again there is a systematic growth in energy consumption. But something clearly happens in 2007: the introduction of load shedding.
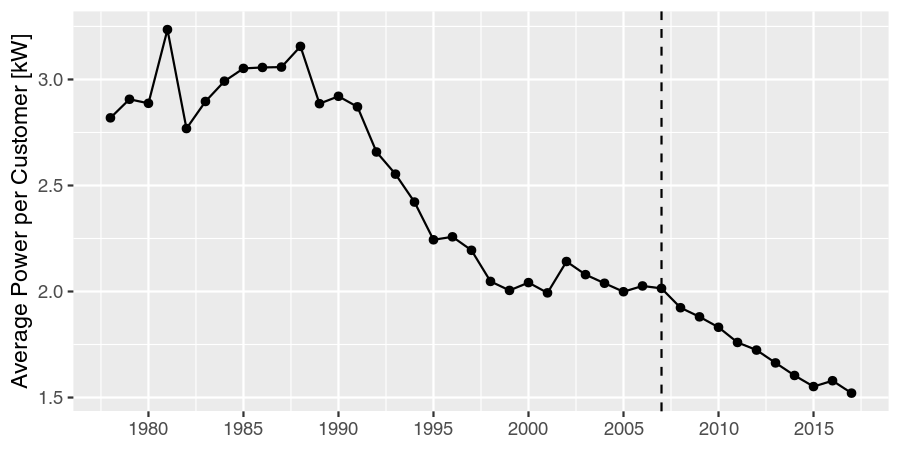
With these two pieces of information we can also assess the average power consumed per customer.
Distribution of Drivers’ Licenses
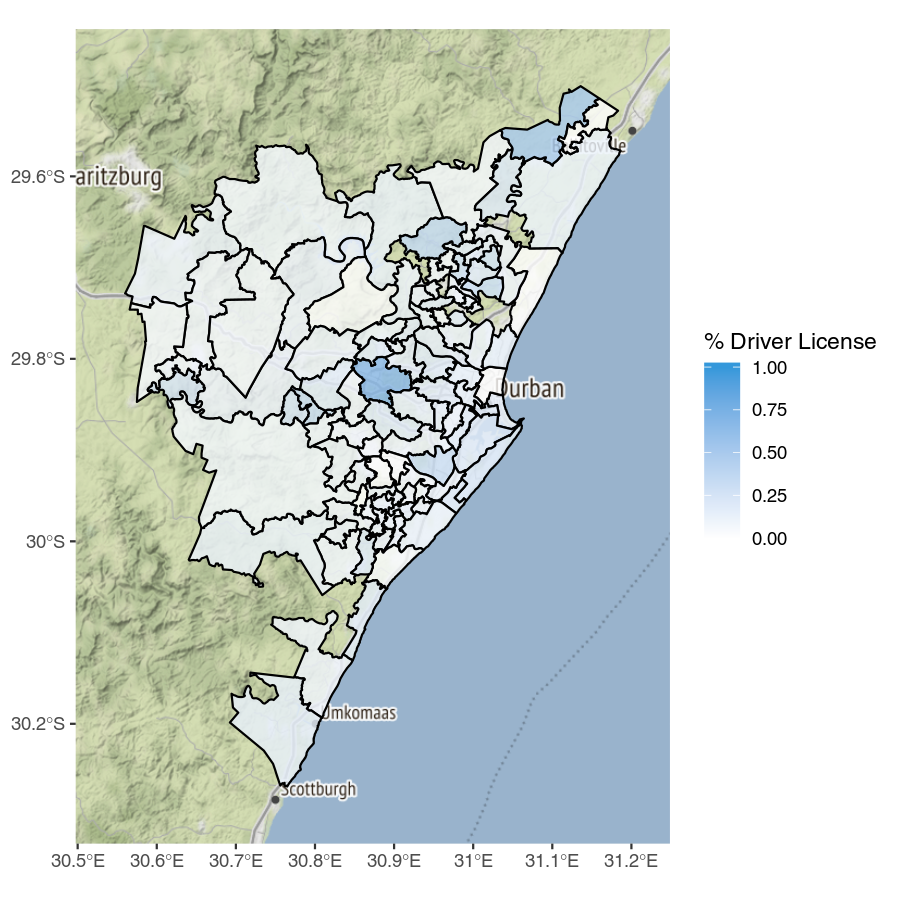
This script merges data from two sources:
- a KML file giving ward boundaries and
- a skills survey.
Although there’s a wealth of informative data in the survey, to keep things simple I used a simple Boolean column: whether or not the respondent had a drivers’ license.
Mashing these two datasets together created the map below: the proportion of people with drivers’ licenses broken down by ward.
Both of these scripts provide potentially interesting starting points for a deeper analysis. The main motivation for them though was simply to show how such an analysis can be done in R.