I came across the Human Ageing Genomic Resources. They are doing some fascinating work and expose some engrossing data. I wanted to make the data easier for me to work with, and an R package seemed to be the natural vehicle to do this.
For more information on these data, take a look at this article: Tacutu, Craig, Budovsky, Wuttke, Lehmann, Taranukha, Costa, Fraifeld and de Magalhaes, “Human Ageing Genomic Resources: Integrated databases and tools for the biology and genetics of ageing,” Nucleic Acids Research 41(D1):D1027-D1033, 2013.
Caveat emptor: I’m not a biologist. In fact, what I know about biology is very sketchy indeed. I’m very happy to be corrected on any of this.
The Package
Install the development package.
remotes::install_github("datawookie/hagr")
Load it into your session.
library(hagr)
At present the package contains a single dataset, age, which captures the AnAge Database of Animal Ageing and Longevity.
What are the columns in age?
names(age)
 [1] "hagrid"                            "domain"
 [3] "kingdom"                           "phylum"
 [5] "class"                             "order"
 [7] "family"                            "genus"
 [9] "species"                           "common_name"
[11] "female_maturity_days"              "male_maturity_days"
[13] "gestation_incubation_days"         "weaning_days"
[15] "litter_clutch_size"                "litters_clutches_per_year"
[17] "inter_litter_inter_birth_interval" "birth_mass_g"
[19] "weaning_mass_g"                    "adult_mass_g"
[21] "growth_rate_per_day"               "maximum_longevity_yr"
[23] "source"                            "specimen_origin"
[25] "sample_size"                       "data_quality"
[27] "imr_per_yr"                        "mrdt_yr"
[29] "metabolic_rate_watt"               "body_mass_g"
[31] "temperature_kelvin"
The domain column has been added for completeness.
Homo Sapiens
Let’s look up a familiar species.
human <- age %>% filter(common_name == "Human")
Where do humans fit into the taxonomy of creatures?
human %>% select(domain:species)
# A tibble: 1 × 8
  domain  kingdom  phylum   class    order    family    genus species
  <chr>   <fct>    <fct>    <fct>    <fct>    <fct>     <fct> <fct>
1 Eukarya Animalia Chordata Mammalia Primates Hominidae Homo  sapiens
How about some relevant masses?
human %>% select(ends_with("_g"))
# A tibble: 1 × 4
  birth_mass_g weaning_mass_g adult_mass_g body_mass_g
         <dbl>          <dbl>        <dbl>       <dbl>
1        3312.          11750        62035       70000
Some other important characteristics.
human %>% select(matches("_(watt|kelvin)$"))
# A tibble: 1 × 2
  metabolic_rate_watt temperature_kelvin
                <dbl>              <dbl>
1                82.8               310.
The average human burns energy at about the same rate as an old incandescent 100 Watt light bulb.

And expected body temperature is 310.15 Kelvin (which converts to 37 °C or 98.6 °F).
Species with Negligible Senescence
Which species don’t appear to age? Well, for example, there’s a cave salamander with a maximum lifespan of over 100 years.
age %>% filter(mrdt_yr == 999) %>% select(common_name, maximum_longevity_yr)
# A tibble: 7 × 2
  common_name                  maximum_longevity_yr
  <chr>                                       <dbl>
1 Olm                                           102
2 Blanding's turtle                              77
3 Eastern box turtle                            138
4 Rougheye rockfish                             205
5 Red sea urchin                                200
6 Ocean quahog clam                             507
7 Great Basin bristlecone pine                 5062
Age and Other Traits
The AnAge data have been used to conduct an analysis of the relationships between longevity and other traits (https://academic.oup.com/biomedgerontology/article/62/2/149/574559, PDF). Let’s try reproducing some of the plots.
We’ll focus on a specific phylum, Chordata, which will allow us to colour points by class without things getting too colourful.
chordata <- age %>% filter(phylum == "Chordata")
What’s the relationship between maximum longevity and mass?
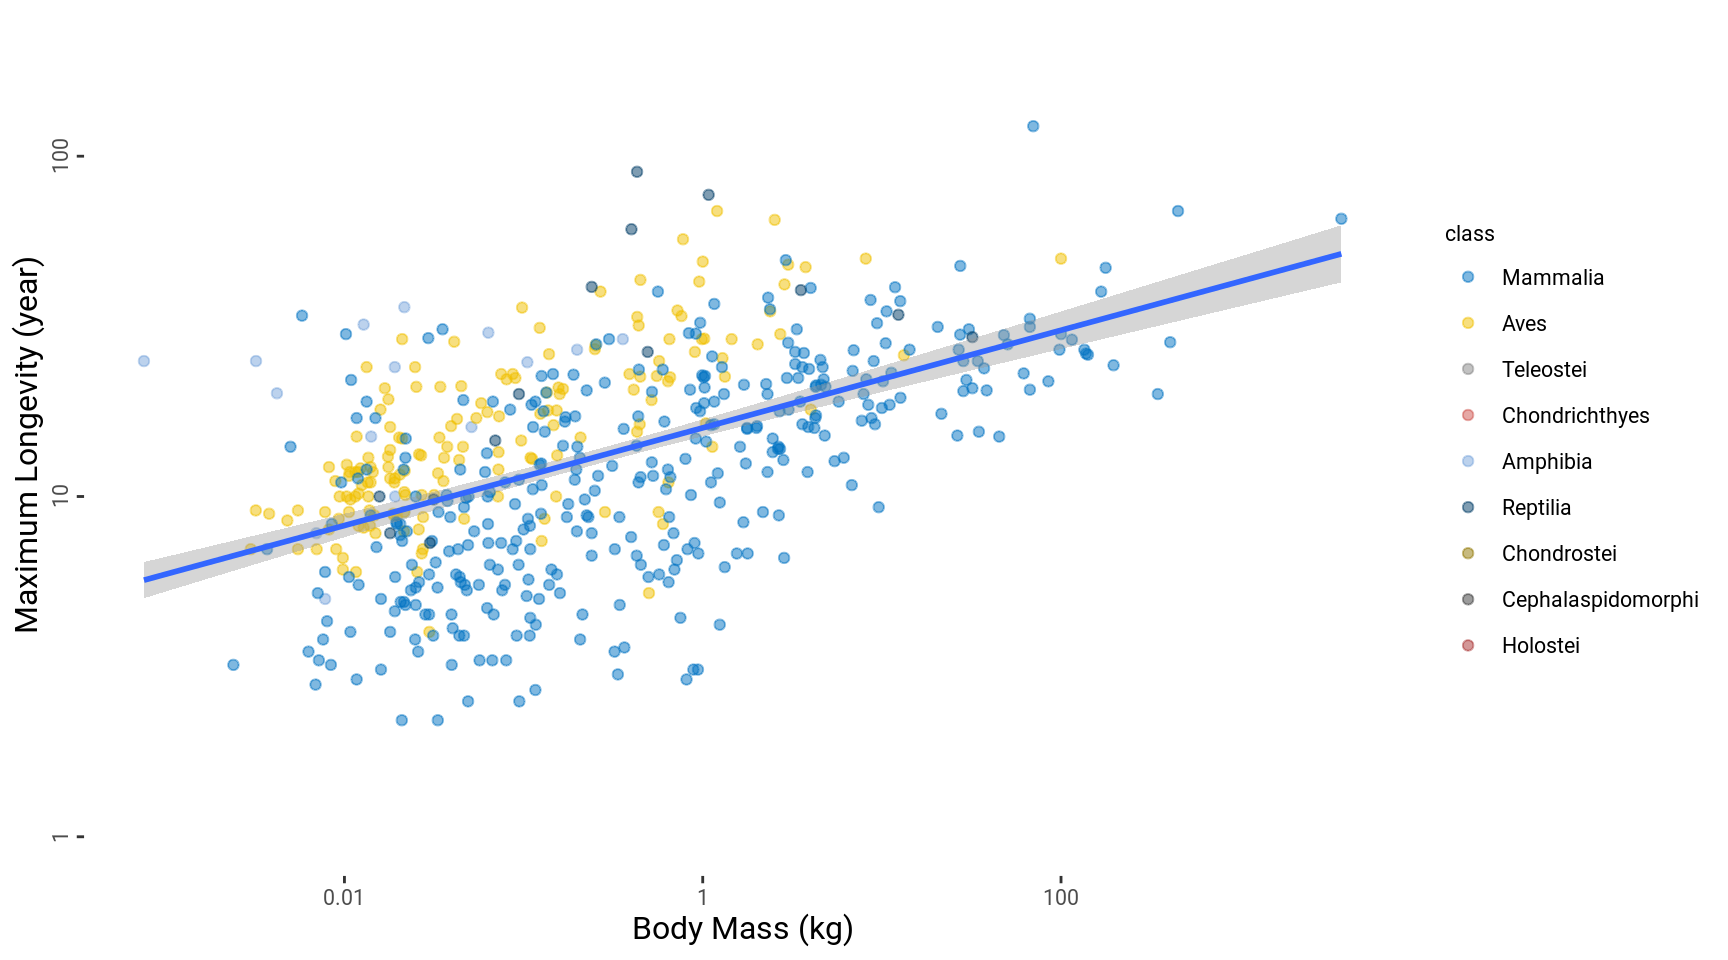
This plot is dominated by birds and mammals (Aves and Mammalia) where there is ample body mass data.
My naive rule of thumb: heavier organisms live longer. Also, for a given mass, birds seem to live longer than mammals. 💡 The data are presented on logarithmic scales and there’s still a lot of scatter.
What about maximum longevity and age at maturity?
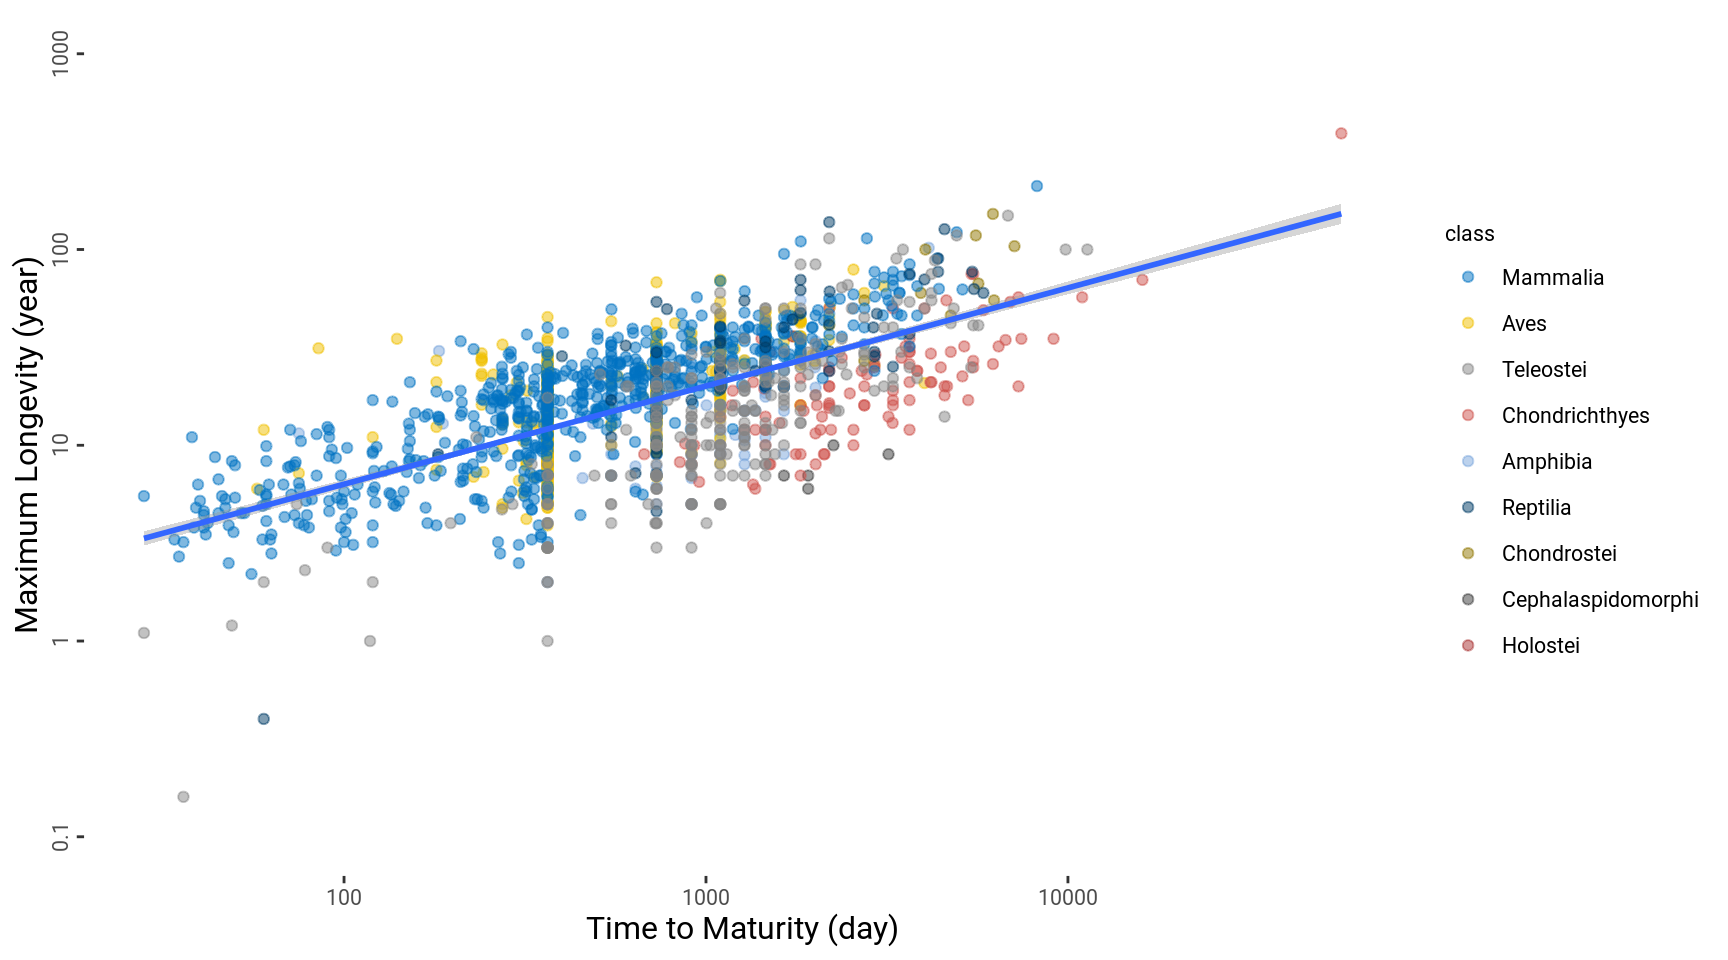
My simplistic interpretation: the longer an organism takes to mature, the longer it will live. This makes sense. Though there are some notable outliers.
Finally, let’s look at the relationship between maximum longevity and growth rate.
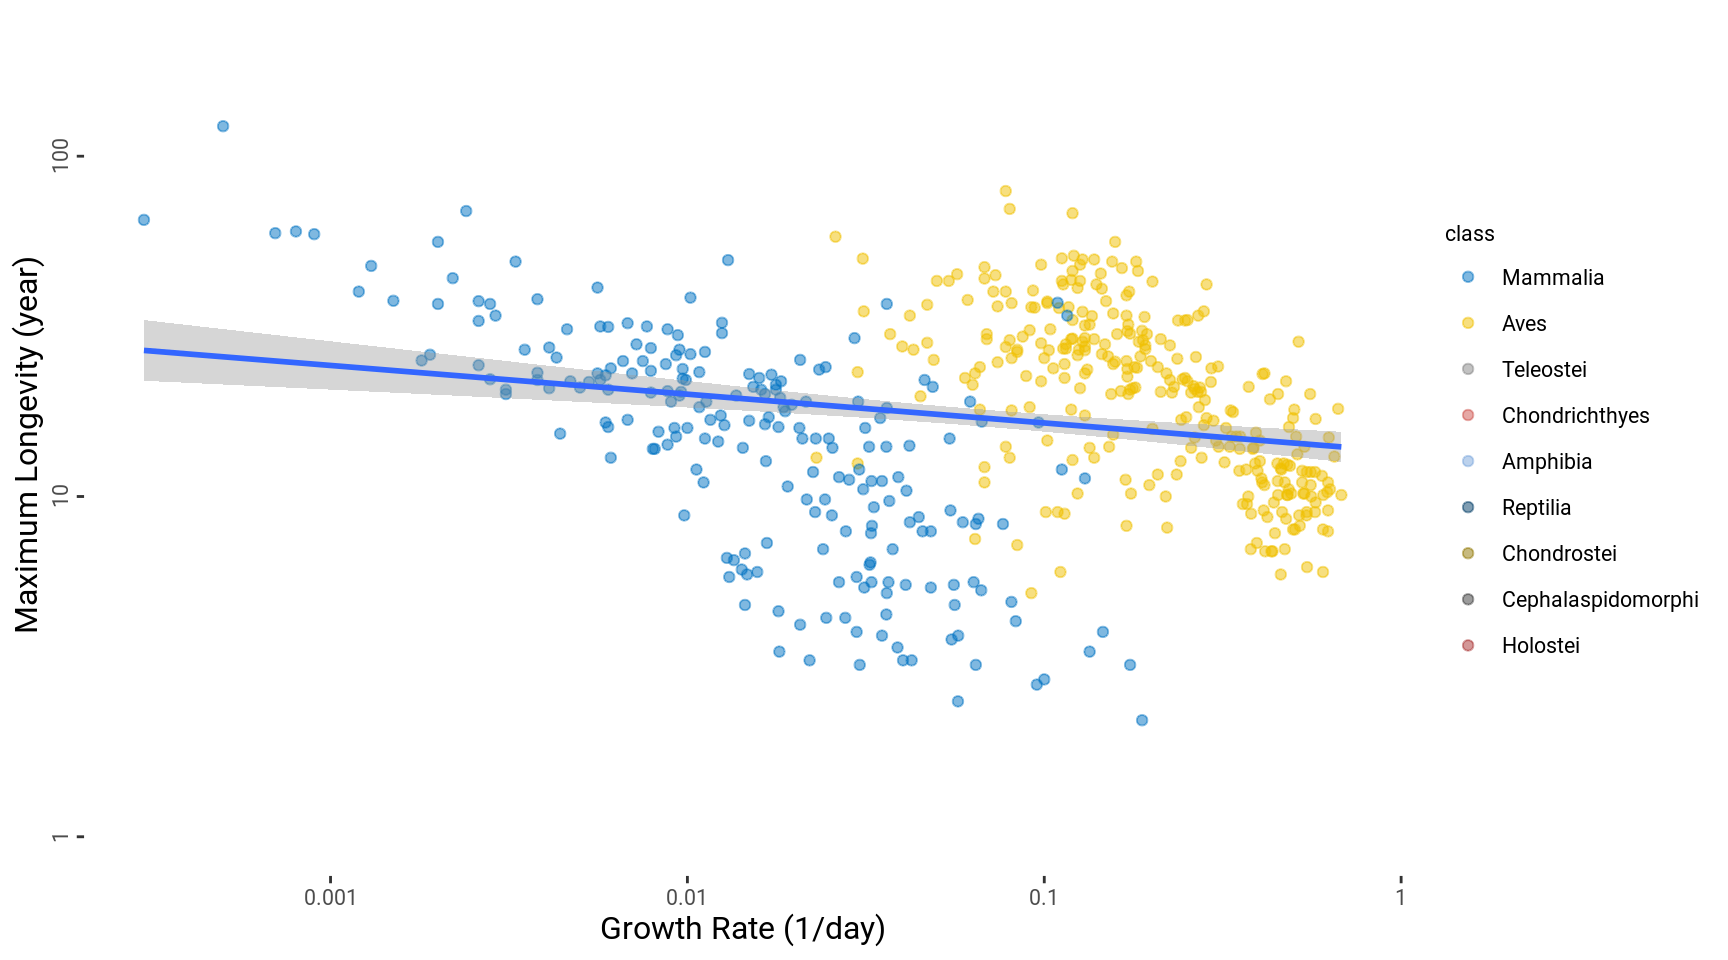
This plot is also dominated by birds and mammals. My superficial understanding: the slower an organism grows, the longer it will live. Again, this makes sense! Also birds generally grow more rapidly than mammals: there’s a nice segregation of these two classes.
Gestation & Mass
It occurred to me that it might be interesting to look at the relationship between gestation period and birth mass.
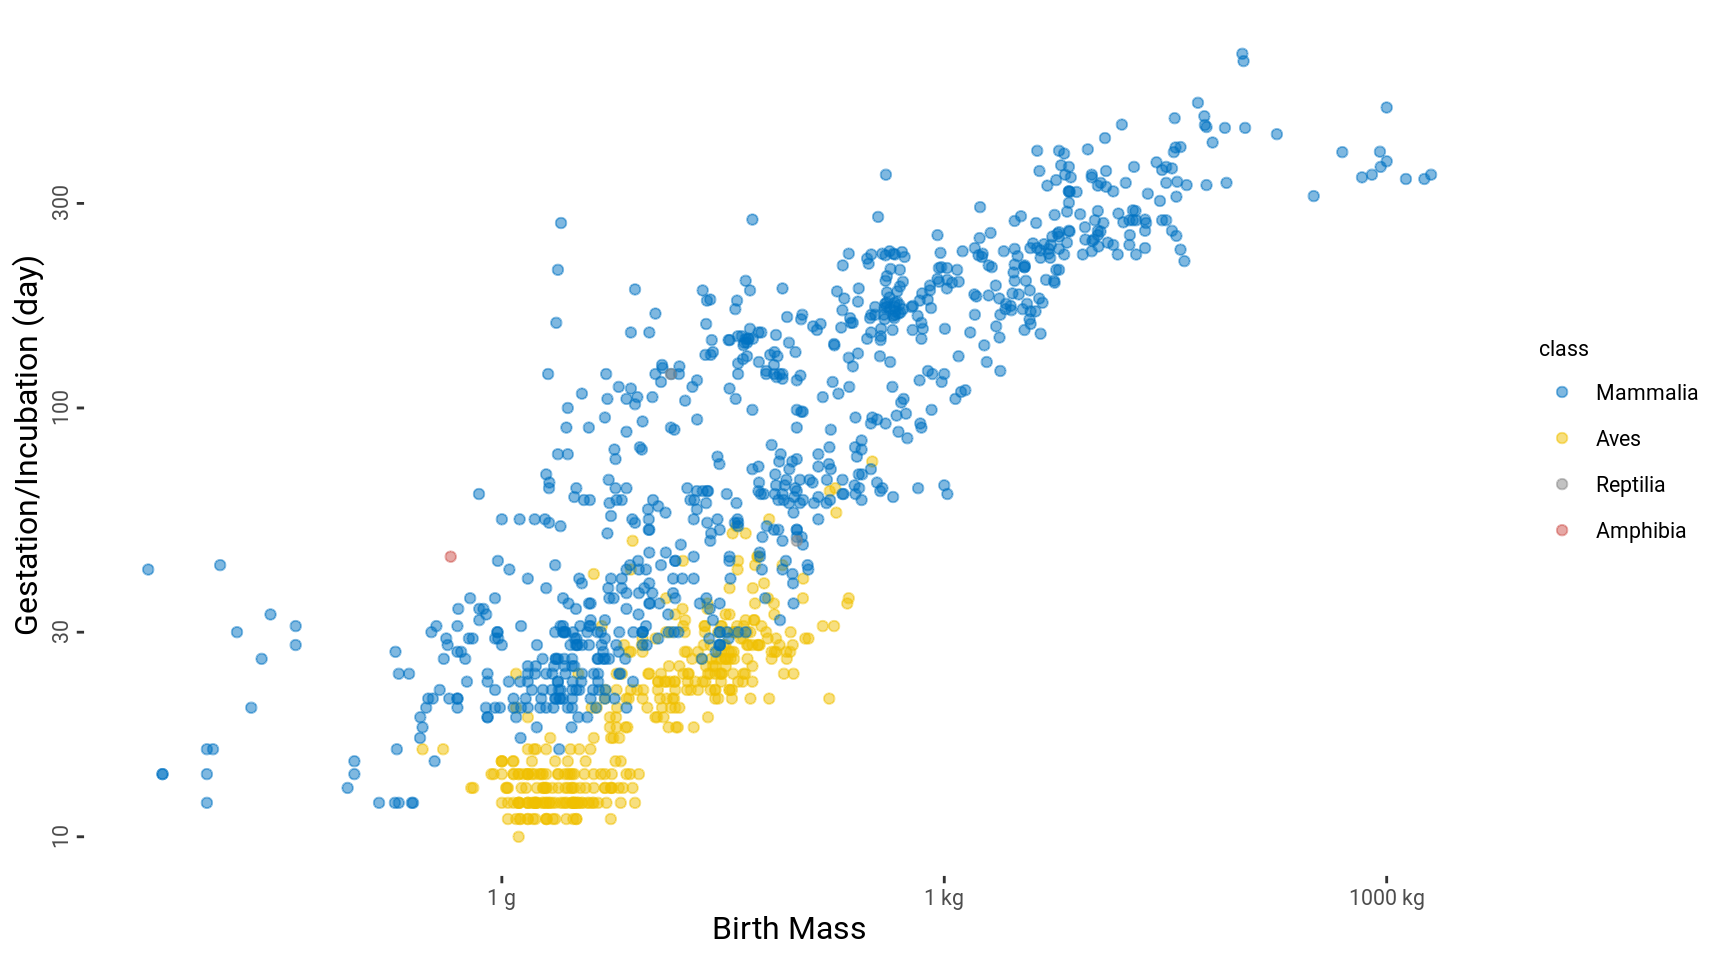
Bottom line appears to be: the bigger it is, the longer it takes to [mb]ake. Makes sense to me.
What About Weaning?
How long does it typically take to wean?
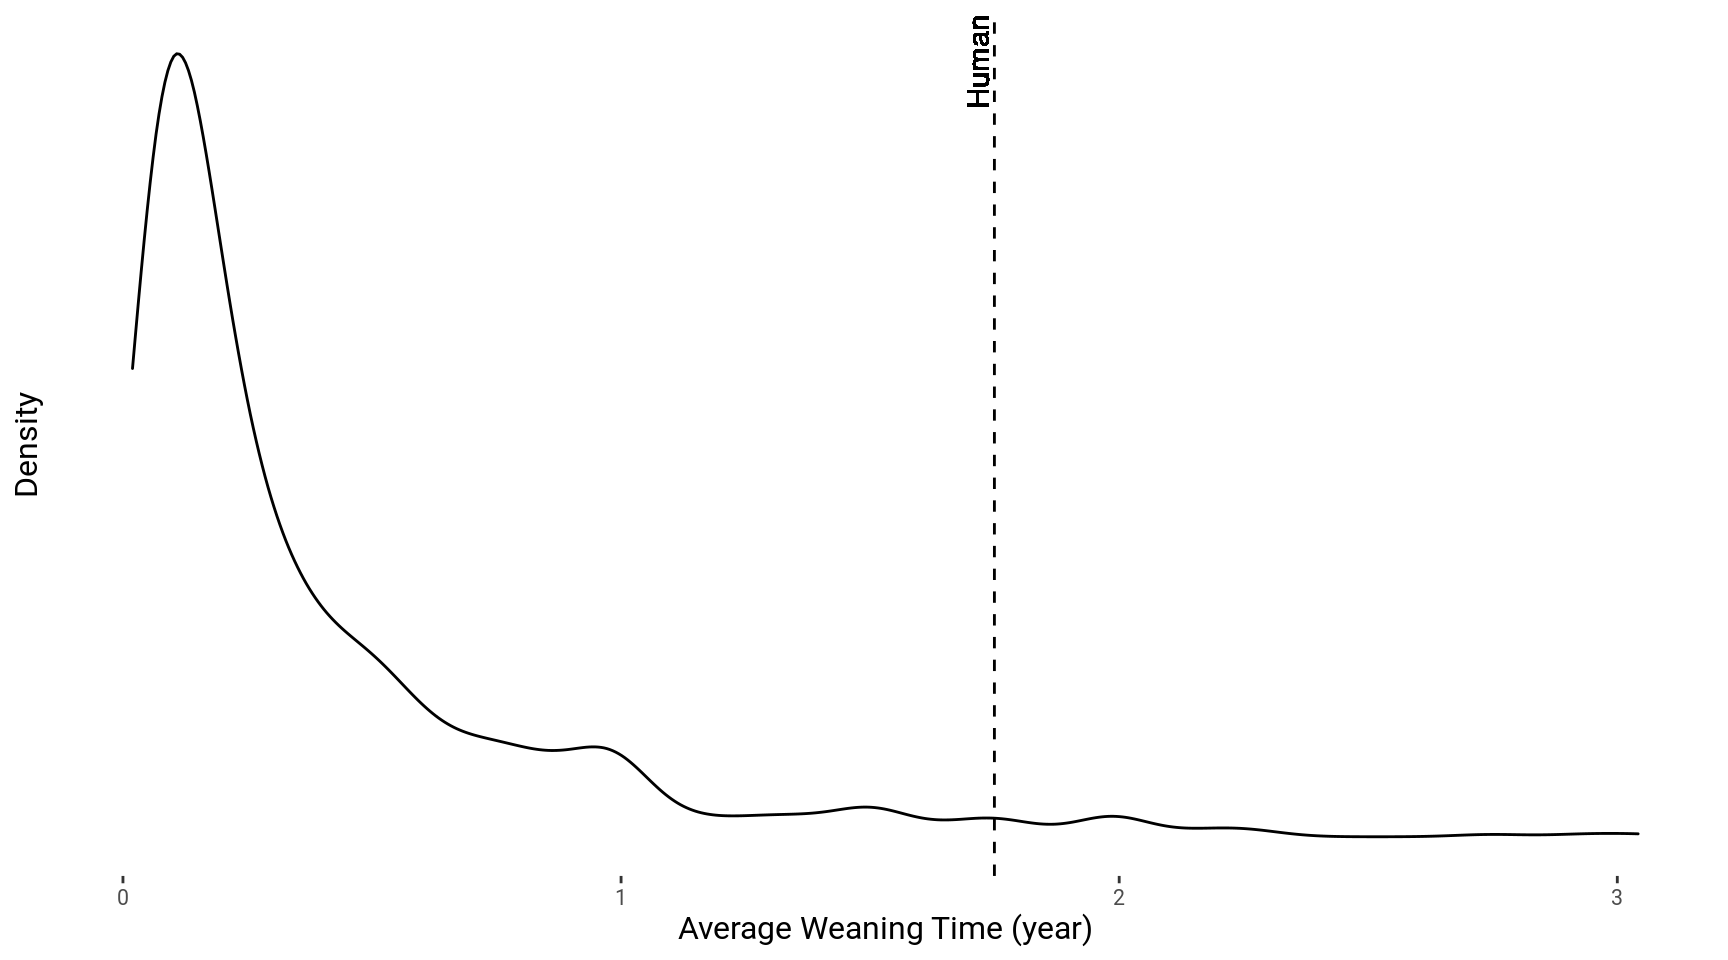
The median weaning time is 77 days. However, the long tail pushes the average out to 144 days.
I’ll dig into other aspects of these data when time permits. Let me know if you find anything interesting!