In the previous post I introduced the {tomtom} package and showed how it can be used for geographic routing. Now we’re going to look at the traffic statistics returned by the TomTom API.
As before we’ll need to load the {tomtom} package and specify an API. Then we’re ready to roll.
Bounding Box
We’ll be retrieving traffic incidents within a bounding box. We’ll define the longitude and latitude extrema of that box (in this case centred on Athens, Greece).
left <- 23.4
bottom <- 37.9
right <- 24.0
top <- 38.2
Traffic Incidents
Now call the incident_details() function to retrieve information on all incidents within that area.
incidents <- incident_details(left, bottom, right, top)The expected duration and description of each incident is provided.
incidents %>% select(incident, begin, end)# A tibble: 205 × 3
incident begin end
<int> <chr> <chr>
1 1 2022-02-03T08:04:00Z 2022-12-31T20:19:00Z
2 2 2022-02-03T08:04:00Z 2022-12-31T20:19:00Z
3 3 2022-03-28T05:51:00Z 2022-03-28T06:20:30Z
4 4 2022-03-18T09:23:04Z 2022-12-31T20:38:00Z
5 5 2022-03-28T05:50:00Z 2022-03-28T06:20:30Z
6 6 2022-03-28T05:39:00Z 2022-03-28T06:21:30Z
7 7 2022-03-28T05:53:33Z 2022-03-28T06:24:30Z
8 8 2022-03-28T03:38:30Z 2022-03-28T06:28:30Z
9 9 2022-02-10T16:23:30Z <NA>
10 10 2021-01-04T07:27:00Z 2022-12-31T20:00:00Z
# … with 195 more rowsYou can also get the type of the incident…
# A tibble: 3 × 2
  incident description
     <int> <fct>
1        1 Roadworks
2        2 Roadworks
3        3 Stationary traffic
… along with a description of where it begins and ends.
# A tibble: 3 × 2
  incident from
     <int> <chr>
1        1 Nea Peramos (EO8)
2        2 Lakka Kalogirou (EO8)
3        3 Ελευθερίας
# A tibble: 3 × 2
incident to
<int> <chr>
1 1 A8, Megara Anatoliki (EO8)
2 2 Nea Peramos (EO8)
3 3 Σοφοκλή Βενιζέλου Finally, the points field allows you to plot the locations of each incident.
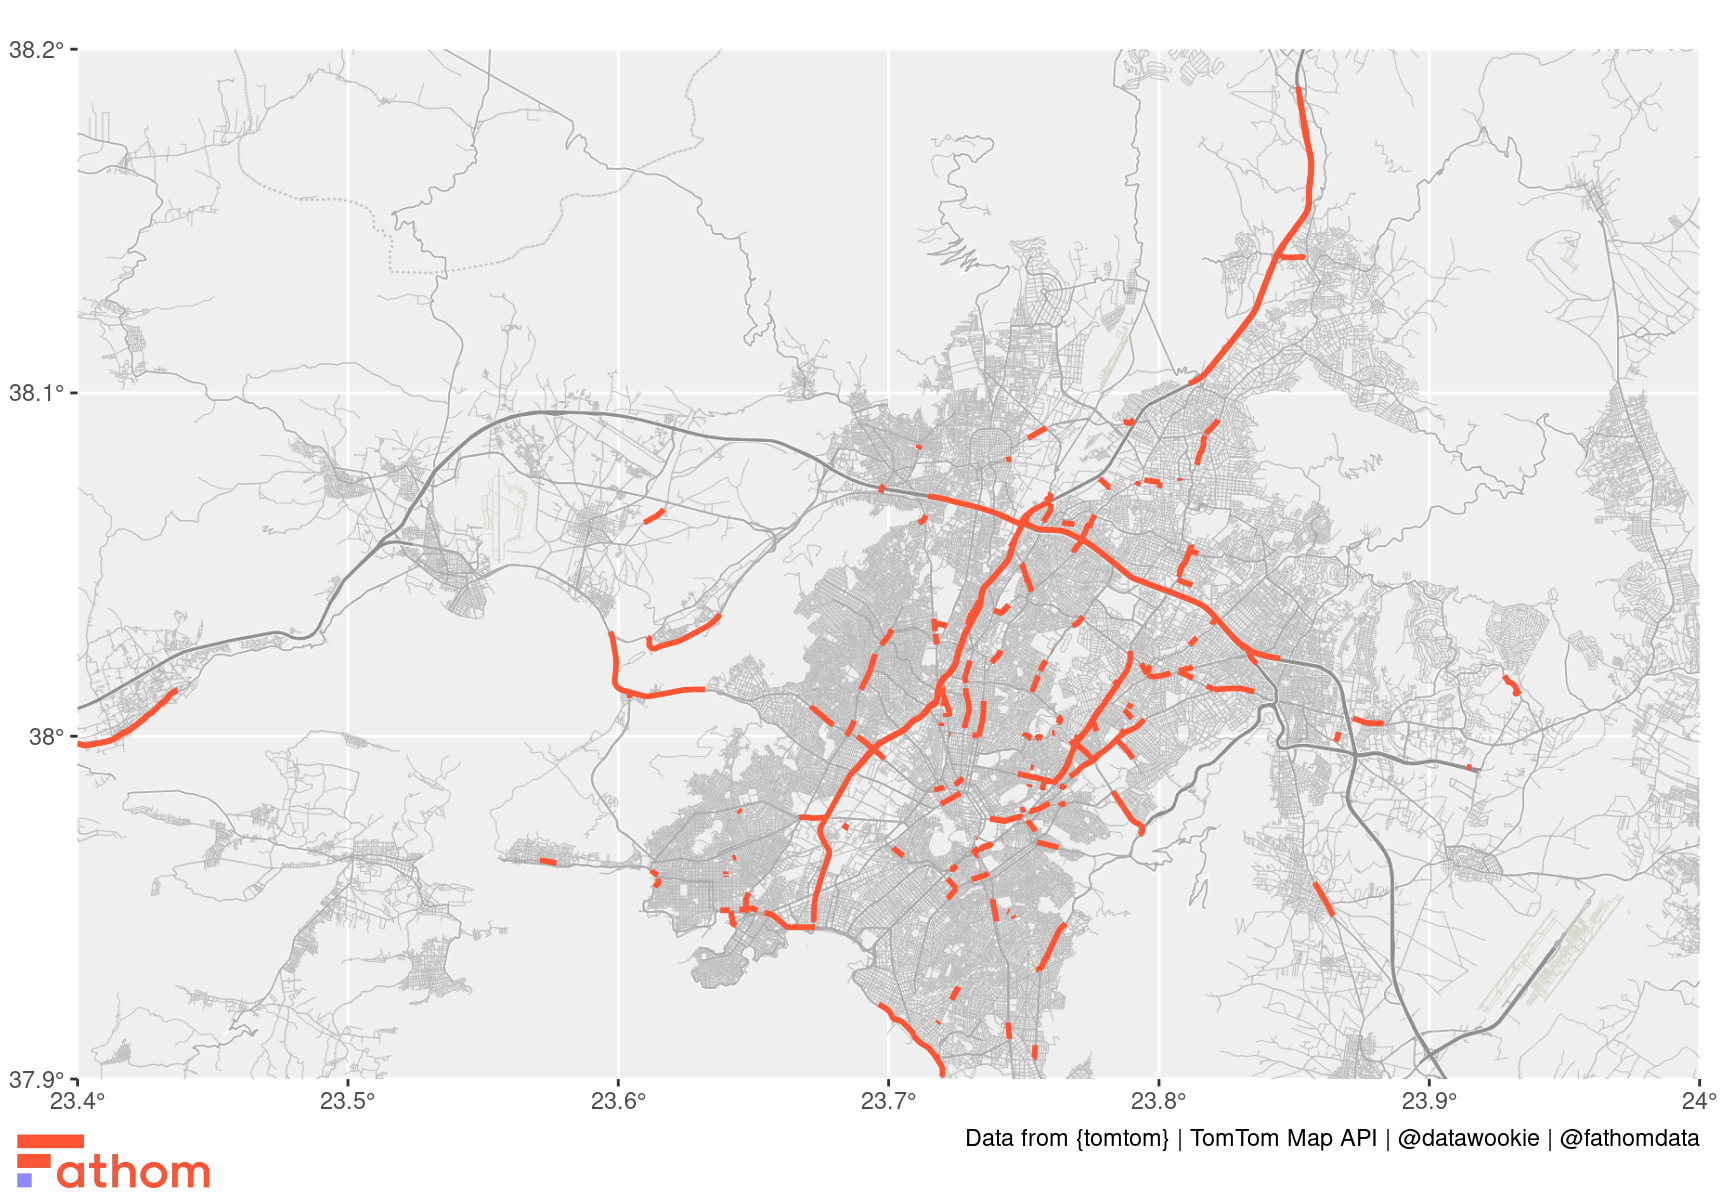
Do yourself a favour and open the above map in a separate tab. The intricate details of the city of Athens are quite fascinating.
The current implementation of the {tomtom} package is really only scratching the surface of the TomTom API. If anybody is keen to collaborate on this, get in touch!