At Fathom Data we have a few projects which require us to send HTTP requests from an evolving selection of IP addresses. This post details the Medusa proxy docker image which uses Tor (The Onion Router) as a proxy.
What is a Proxy Server?
A proxy server acts as an intermediary between a client and a server. When a request goes through a proxy server there is no direct connection between the client and the server. The client connects to the proxy and the proxy then connects to the server. Requests and responses pass through the proxy.

HTTP & SOCKS Proxies
HTTP (HyperText Transfer Protocol) is the dominant protocol for information exchange on the internet. HTTP is connectionless. This means that the client (often a browser) sends a request to a server. The server then replies with a response. Once this interaction is over there is no persistent connection between the client and the server. Any further interactions require new connections.
An HTTP proxy uses the HTTP protocol for all interactions with the client and server. As a result, an HTTP proxy is only able to handle HTTP and HTTPS requests. An HTTP proxy is also able to filter or modify the content of the requests and responses passing through it.
SOCKS is another internet protocol. Whereas as HTTP is an application layer protocol (at the top of the OSI Model), SOCKS is a lower level protocol in the session layer.
A SOCKS proxy uses the SOCKS protocol. Since it’s secure (the name is an abbreviation for “SOCKet Secure”), a SOCKS proxy cannot understand the contents of requests or responses, so is unable to modify or filter them. Since it operates at a lower level in the networking hierarchy, a SOCKS proxy is also faster and more flexible than an HTTP proxy.
Tor Proxy Docker Image
We constructed a Docker image which uses the Tor network to expose both SOCKS and HTTP proxies. The image uses the following components:
The relationship between these components is detailed in the figure below.

Tor
Tor provides an anonymous SOCKS proxy. The image will run multiple Tor instances, each of which will (in general) have a different exit node. This means that requests being routed through each instance will appear to come from a distinct IP address.
HAProxy
HAProxy is a high availability proxy server and load balancer (spreads requests across multiple services). HAProxy is used to distribute SOCKS requests across the Tor instances using a round robin scheduling strategy.
Privoxy
To provide for services that prefer to communicate via HTTP or cannot communicate via SOCKS, Privoxy is used to accept HTTP requests and forward them as SOCKS requests to HAProxy.
Running the Docker Image
Let’s spin up a container and take a look.
docker run \
    -p 8800:8800 \
    -p 8888:8888 \
    -p 1080:1080 \
    -p 2090:2090 \
    datawookie/medusa-proxy
We’re mapped a lot of ports.
- 8800 — list of proxy URLs (as
text/plain) - 8888 — Privoxy port (HTTP protocol)
- 1080 — HAProxy port (SOCKS protocol) and
- 2090 — HAProxy statistics port.
Not all of them are required, but they all fulfill a distinct purpose. Below are some alternative ways to invoke the image.
# HTTP proxy on port 8888
docker run -p 8888:8888 datawookie/medusa-proxy
# SOCKS proxy on port 1080
docker run -p 1080:1080 datawookie/medusa-proxy
# Both HTTP and SOCKS proxies
docker run -p 8888:8888 -p 1080:1080 datawookie/medusa-proxy
Once we’ve got a running container we can set up a client to use the proxy. We’ll start with a browser and then look at curl on the command line.
Browser
Set up your browser to use the HTTP proxy. You could equally choose to use the SOCKS proxy, which will have an IP address of 127.0.0.1 and port 1080.
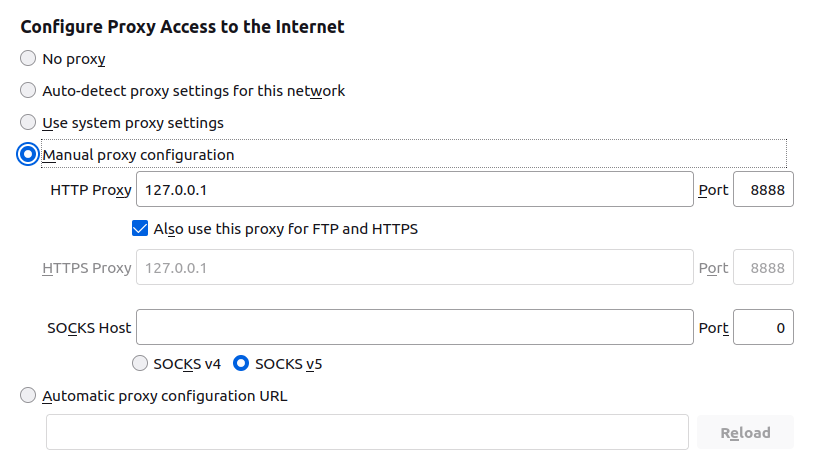
Once you’ve configured the proxy settings in your browser, head over to What Is My IP Address to check on your effective IP address. Refresh the page to confirm that the IP address changes.
Testing
Further testing is easier to do (and record) on the command line. To illustrate how the proxy works we’ll send requests to http://httpbin.org/ip to retrieve our effective IP address.
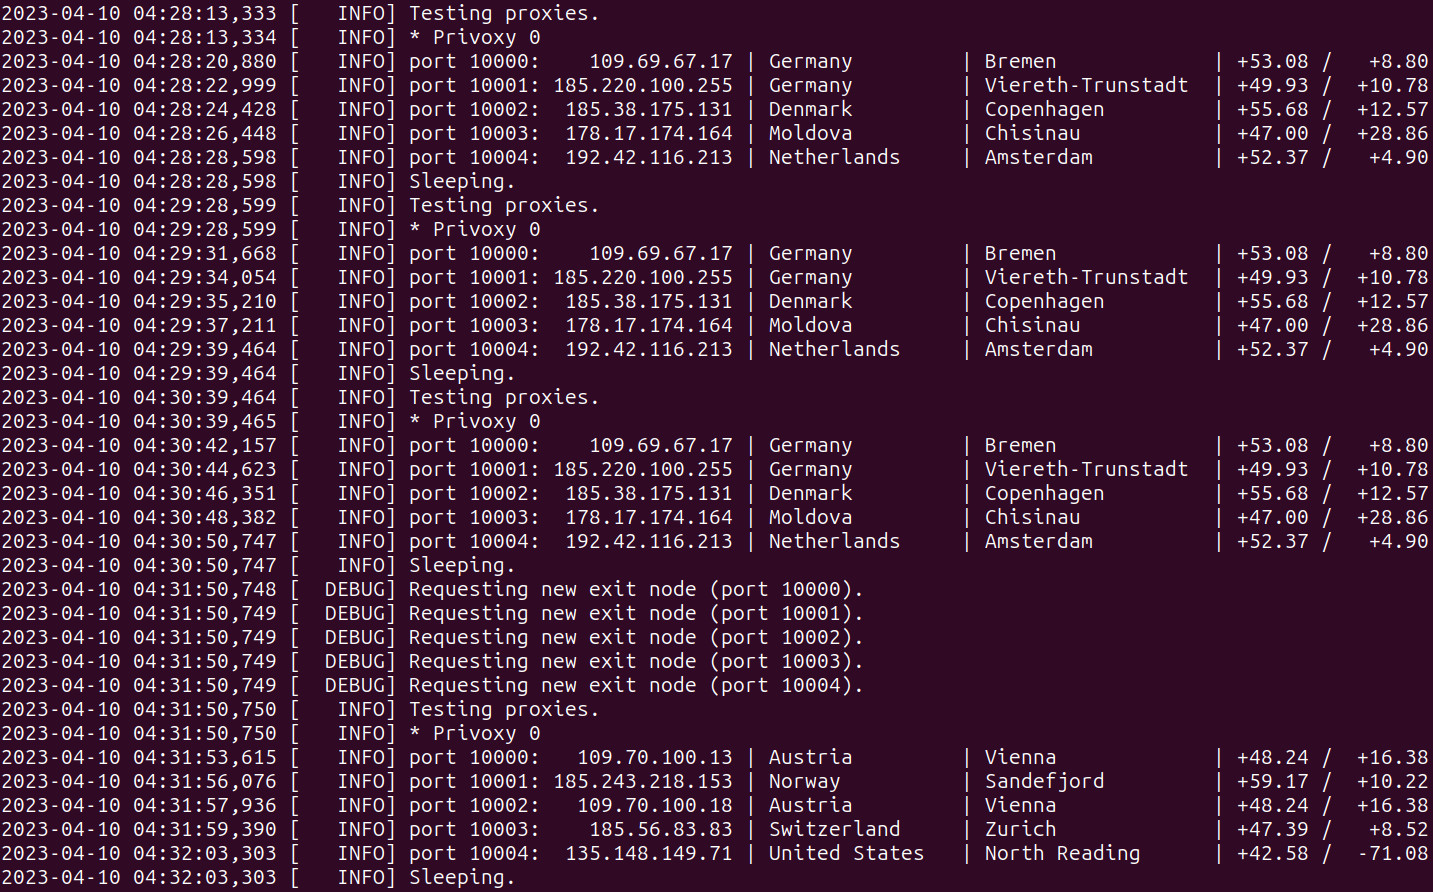
First let’s look at the set of IP addresses reported by the container. Below is an extract from the Docker logs. Each exit node is tested periodically and its effective IP address is logged.
port 10000:    185.56.83.83 | Switzerland     | Zurich             | +47.39 /   +8.52
port 10001:     45.66.35.35 | Netherlands     | Amsterdam          | +52.36 /   +4.79
port 10002:  192.42.116.217 | Netherlands     | Amsterdam          | +52.37 /   +4.90
port 10003:    109.70.100.9 | Austria         | Vienna             | +48.24 /  +16.38
port 10004:    198.96.155.3 | Canada          | Kitchener          | +43.44 /  -80.49
Don’t worry about the port numbers (those are only relevant within the container). Note that there are five proxies (one for each Tor instance) and that each has a different IP address.
Set the http_proxy environment variable so that curl uses the proxy.
export http_proxy=http://127.0.0.1:8888Now send out a series of requests.
curl http://httpbin.org/ip{
"origin": "195.154.35.52"
}curl http://httpbin.org/ip{
"origin": "178.20.55.18"
}curl http://httpbin.org/ip{
"origin": "195.176.3.24"
}curl http://httpbin.org/ip{
"origin": "185.220.100.252"
}curl http://httpbin.org/ip{
"origin": "185.220.101.198"
}curl http://httpbin.org/ip{
"origin": "195.154.35.52"
}Notice that each request appears to originate from a distinct IP address and that once we’ve cycled through all of the Tor instances, we wrap back to the first one.
Rotating
The exit nodes are periodically rotated. Some time later we see that we’re using a different set of IP addresses.
port 10000:     45.66.35.10 | Netherlands     | Amsterdam          | +52.36 /   +4.79
port 10001: 185.220.101.175 | Germany         | Brandenburg        | +52.62 /  +13.12
port 10002:  185.220.101.87 | Germany         | Brandenburg        | +52.62 /  +13.12
port 10003:   23.129.64.228 | United States   | Seattle            | +47.60 / -122.34
port 10004:  192.42.116.213 | Netherlands     | Amsterdam          | +52.37 /   +4.90
Here’s an extract from the logs of a live session that shows the change in nodes.
A Weakness
This is great, but there’s one major weakness: if a request via any one of the Tor instances fails then the proxy would be marked as broken (regardless of whether the other Tor instances were fine or not). To get around this I have been running multiple containers, each assigned to a different port. With this setup, even if a few of the containers are marked as broken, there are still others which are considered healthy and able to accept requests. Although easy enough to automate, the logistics associated with this setup are a little onerous.
Wouldn’t it be convenient if there was just a single container which exposes multiple proxies, each of which is hooked up to a distinct set of Tor instances?
Why would a Tor instance fail? I can think of at least two plausible reasons:
- There is actually a problem with the Tor exit node and it’s not currently processing requests.
- The exit node might be blocked by the target site. This might either be based on geolocation of the exit node or its IP address (there’s an actively maintained list of Tor exit nodes).
Beast with Many Heads
Rather than exposing just a single unit per container, the Medusa proxy can cater for multiple proxy units or heads. What this means is that there can be multiple copies of the components illustrated in the diagram above. All heads are served from the same network location but on different ports.
There are a few environment variables which can be used to tweak the configuration:
TORS— Number of heads (default: 2)TORS— Number of Tor instances (default: 5)HAPROXY_LOGIN— Username for HAProxy (default: “admin”)HAPROXY_PASSWORD— Password for HAProxy (default: “admin”)
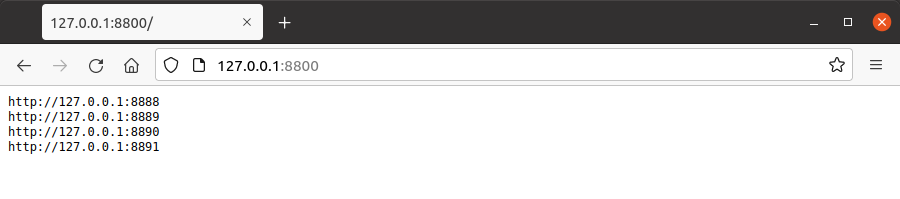
Let’s give this a try. We’ll launch Medusa with 4 heads (each linking to 3 Tor instances) and only map the ports for the HTTP proxies.
docker run \
    -e HEADS=4 \
    -e TORS=3 \
    -p 8800:8800 \
    -p 8888:8888 -p 8889:8889 -p 8890:8890 -p 8891:8891 \
    datawookie/medusa-proxy
Now we have 4 heads at ports 8888, 8889, 8890 and 8891. If we look at the Docker logs then we see that there are 3 Tor endpoints for each head.
* Privoxy 0
port 10000:    185.195.71.3 | Switzerland     | Zurich             | +47.39 /   +8.52
port 10001:    185.129.61.8 | Denmark         | Graested           | +56.10 /  +12.20
port 10002:  192.42.116.178 | Netherlands     | Amsterdam          | +52.37 /   +4.90
* Privoxy 1
port 10003: 185.220.101.140 | Germany         | Brandenburg        | +52.62 /  +13.12
port 10004:    185.195.71.3 | Switzerland     | Zurich             | +47.39 /   +8.52
port 10005: 185.220.101.139 | Germany         | Brandenburg        | +52.62 /  +13.12
* Privoxy 2
port 10006:   109.70.100.14 | Austria         | Vienna             | +48.24 /  +16.38
port 10007:  85.204.116.239 | Romania         | Timișoara          | +45.74 /  +21.21
port 10008:  179.43.178.118 | Switzerland     | Zurich             | +47.39 /   +8.52
* Privoxy 3
port 10009:    109.70.100.7 | Austria         | Vienna             | +48.24 /  +16.38
port 10010:  185.220.101.48 | Germany         | Brandenburg        | +52.62 /  +13.12
port 10011:  192.42.116.213 | Netherlands     | Amsterdam          | +52.37 /   +4.90
Proxy List
A proxy list is served as a plain text file on port 8800. This can be used to configure rotating proxies in clients.
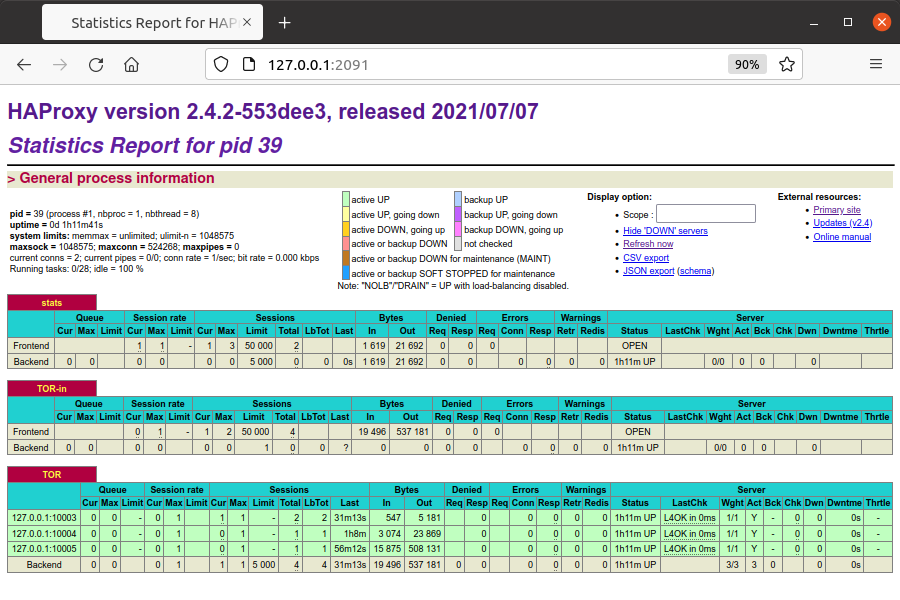
Statistics
You can monitor the performance of the proxies via the statistics interface, which each HAProxy instance exposes via a port numbered sequentially from 2090.
Using Medusa with Requests Package
Let’s take a look at using the proxy with Python and the requests package.
import requests

# Request without proxy.
#
r = requests.get("http://httpbin.org/ip")
print(r.text)

# Request with proxy.
#
proxy  = "http://127.0.0.1:8888"
proxies = {
    "http"  : proxy,
    "https"  : proxy
}
#
r = requests.get("http://httpbin.org/ip", proxies=proxies)
print(r.text)
Run the script.
{
  "origin": "2.100.134.203"
}
{
  "origin": "193.189.100.201"
}
Run it again.
{
  "origin": "2.100.134.203"
}
{
  "origin": "192.42.116.177"
}
The first IP address remains the same (this request is not sent via the proxy) but the second IP address changes (because it was sent through the proxy).
Using Medusa with Scrapy
We developed Medusa Proxy with the primary intention of using it with the scrapy-rotating-proxies Scrapy package.
Here are some logs extracted from a problematic crawler using 4 heads. If there had just been a single proxy then this would not have worked well at all.
2021-10-01 03:05:29 INFO:  Proxies(good: 0, dead: 0, unchecked: 4, reanimated: 0, mean backoff time: 0s)
2021-10-01 03:05:29 DEBUG: Proxy <http://127.0.0.1:8890> is GOOD
2021-10-01 03:05:36 DEBUG: Proxy <http://127.0.0.1:8889> is DEAD
2021-10-01 03:05:51 DEBUG: GOOD proxy became DEAD: <http://127.0.0.1:8890>
2021-10-01 03:05:59 INFO:  Proxies(good: 0, dead: 2, unchecked: 2, reanimated: 0, mean backoff time: 47s)
2021-10-01 03:06:00 DEBUG: Proxy <http://127.0.0.1:8889> is DEAD
2021-10-01 03:06:13 DEBUG: Proxy <http://127.0.0.1:8890> is DEAD
2021-10-01 03:06:24 DEBUG: Proxy <http://127.0.0.1:8888> is DEAD
2021-10-01 03:06:29 INFO:  Proxies(good: 0, dead: 3, unchecked: 1, reanimated: 0, mean backoff time: 29s)
2021-10-01 03:06:29 DEBUG: 1 proxies moved from 'dead' to 'reanimated'
2021-10-01 03:06:34 DEBUG: 1 proxies moved from 'dead' to 'reanimated'
2021-10-01 03:06:36 DEBUG: Proxy <http://127.0.0.1:8890> is DEAD
2021-10-01 03:06:52 DEBUG: Proxy <http://127.0.0.1:8890> is DEAD
2021-10-01 03:06:59 INFO:  Proxies(good: 0, dead: 1, unchecked: 1, reanimated: 2, mean backoff time: 175s)
2021-10-01 03:07:06 DEBUG: Proxy <http://127.0.0.1:8891> is DEAD
2021-10-01 03:07:22 DEBUG: Proxy <http://127.0.0.1:8890> is GOOD
2021-10-01 03:07:29 INFO:  Proxies(good: 1, dead: 1, unchecked: 0, reanimated: 2, mean backoff time: 46s)
2021-10-01 03:07:37 DEBUG: Proxy <http://127.0.0.1:8888> is DEAD
2021-10-01 03:07:50 DEBUG: Proxy <http://127.0.0.1:8891> is DEAD
2021-10-01 03:07:59 INFO:  Proxies(good: 1, dead: 2, unchecked: 0, reanimated: 1, mean backoff time: 42s)
2021-10-01 03:08:04 DEBUG: 1 proxies moved from 'dead' to 'reanimated'
2021-10-01 03:08:04 DEBUG: Proxy <http://127.0.0.1:8888> is DEAD
2021-10-01 03:08:18 DEBUG: Proxy <http://127.0.0.1:8891> is DEAD
2021-10-01 03:08:29 INFO:  Proxies(good: 1, dead: 2, unchecked: 0, reanimated: 1, mean backoff time: 63s)
2021-10-01 03:08:33 DEBUG: Proxy <http://127.0.0.1:8891> is DEAD
2021-10-01 03:08:43 DEBUG: Proxy <http://127.0.0.1:8888> is DEAD
2021-10-01 03:08:55 DEBUG: Proxy <http://127.0.0.1:8891> is DEAD
2021-10-01 03:08:59 INFO:  Proxies(good: 1, dead: 2, unchecked: 0, reanimated: 1, mean backoff time: 171s)
2021-10-01 03:08:59 DEBUG: 1 proxies moved from 'dead' to 'reanimated'
2021-10-01 03:09:09 DEBUG: Proxy <http://127.0.0.1:8888> is DEAD
2021-10-01 03:09:23 DEBUG: Proxy <http://127.0.0.1:8889> is GOOD
2021-10-01 03:09:29 INFO:  Proxies(good: 2, dead: 1, unchecked: 0, reanimated: 1, mean backoff time: 62s)
2021-10-01 03:09:36 DEBUG: GOOD proxy became DEAD: <http://127.0.0.1:8890>
2021-10-01 03:09:52 DEBUG: Proxy <http://127.0.0.1:8890> is DEAD
2021-10-01 03:09:59 INFO:  Proxies(good: 1, dead: 2, unchecked: 0, reanimated: 1, mean backoff time: 68s)
2021-10-01 03:10:12 DEBUG: GOOD proxy became DEAD: <http://127.0.0.1:8889>
2021-10-01 03:10:14 DEBUG: 1 proxies moved from 'dead' to 'reanimated'
2021-10-01 03:10:24 DEBUG: 1 proxies moved from 'dead' to 'reanimated'
2021-10-01 03:10:29 INFO:  Proxies(good: 0, dead: 1, unchecked: 0, reanimated: 3, mean backoff time: 73s)
2021-10-01 03:10:59 INFO:  Proxies(good: 0, dead: 1, unchecked: 0, reanimated: 3, mean backoff time: 73s)
The logs reflect the current state of each of the proxies, which can be either:
good— working finedead— brokenunchecked— has not yet been used; orreanimated— previously broken but now ready to be tried again. Areanimatedproxy might become eithergoodordeaddepending on how it functions when next used.
Technical Details
The image is derived from the official Alpine image, onto which Python 3, Tor, HAProxy and Privoxy are installed. The configuration files for each of the services are created using Jinja templates.
The source code for the image can be found here. Contributions to the project are gratefully accepted.