I’m building a model which requires historical weather data from a selection of locations in South Africa. In this post I demonstrate the process of acquiring the data and doing some simple processing.
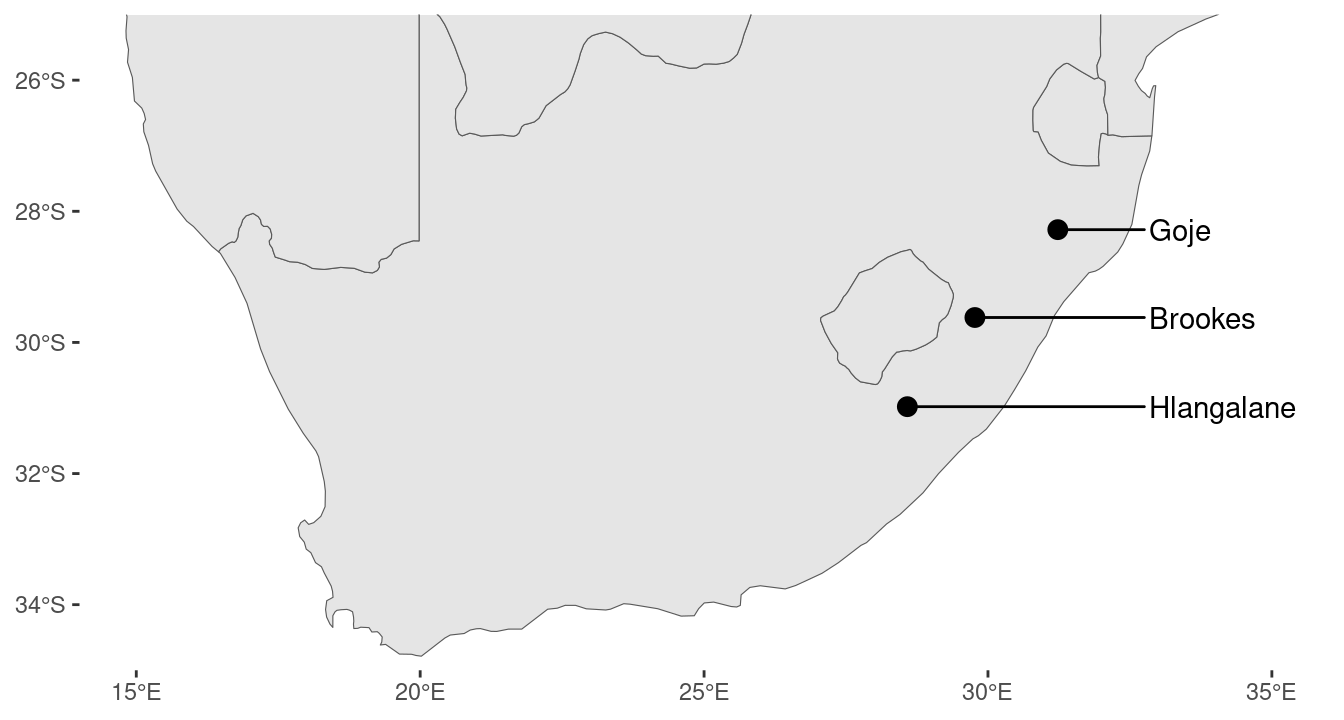
I need data for three locations: Brookes and Goje (in KwaZulu-Natal) and Hlangalane (in the Eastern Cape).
# A tibble: 3 × 4
  name       region          lat   lon
  <chr>      <chr>         <dbl> <dbl>
1 Brookes    KwaZulu-Natal -29.6  29.8
2 Goje       KwaZulu-Natal -28.3  31.2
3 Hlangalane Eastern Cape  -31.0  28.6
Here are those locations on a map. They are sufficiently far apart that we would expect them to have different weather histories.

Data Acquisition
I’m getting the data using Weather API. The business plan gives me access to data going back to the beginning of 2010. I like to mix things up, so I’ll hit the API from Python and then use R to do the processing.
The API key is stored in an environment variable.
import os

API_KEY = os.getenv("WEATHER_API_KEY")
Define the date range.
import pandas as pd

DATE_MIN = "2020-08-01"
DATE_MAX = "2022-08-01"

DATES = pd.date_range(start=DATE_MIN, end=DATE_MAX)
Create a function for retrieving the data and writing it to a file. There will be one JSON file per location and date.
import re
import requests

def weather_history(name, region):
  location = name+", "+region
  slug = re.sub("[, ]+", "-", location.lower())

  for date in DATES:
    date = date.date()

    URL = f"http://api.weatherapi.com/v1/history.json?key={API_KEY}&q={location}&dt={date}"

    response = requests.get(URL)

    with open(f"{date}-{slug}.json", "wt") as fid:
      fid.write(response.text)

    time.sleep(5)
Now retrieve the data.
weather_history("Goje", "KwaZulu-Natal")
Repeat for the other locations.
Data Processing
We’ll need a function for loading the JSON data into R. The data are nested, so we’ll include some code to unwrap and rectangle the data.
library(jsonlite)

prepare_weather <- function(path) {
  weather <- read_json(path)

  weather$location %>%
    as_tibble() %>%
    # Drop time fields that relate to data acquisition (download) time.
    select(-starts_with("localtime")) %>%
    mutate(
      hours = weather$forecast$forecastday %>%
        map_dfr(function(day) {
          map_dfr(day$hour, function(hour) {
            hour$condition <- NULL
            hour
          })
        }) %>%
        select(-ends_with("epoch")) %>%
        select(-matches("_(mph|f|in|miles)$")) %>%
        select(-matches("^(will_it|chance_of)_")) %>%
        list()
    )
}
Let’s read the data for Goje on 1 August 2021.
(goje <- prepare_weather("2021-08-01-goje-kwazulu-natal.json"))
# A tibble: 1 × 7
  name  region        country        lat   lon tz_id               hours
  <chr> <chr>         <chr>        <dbl> <dbl> <chr>               <list>
1 Goje  KwaZulu-Natal South Africa -28.3  31.2 Africa/Johannesburg <tibble [24 × 16]>
The hours list column contains the hourly weather data. The data contains the following fields:
- temperature
- temperature feels like
- wind chill
- heat index
- dew point
- wind speed and direction
- wind gust speed
- pressure
- precipitation
- humidity
- cloud cover and
- visibility.
Let’s take a quick look. We’ll only pull out a few columns that are relevant to the model.
goje %>%
  unnest(cols = hours) %>%
  # Use appropriate time zone when converting to date/time type.
  mutate(time = as.POSIXct(time, "%Y-%m-%d %H:%M", tz = unique(tz_id))) %>%
  select(time, temp_c, wind_kph, wind_dir, pressure_mb, precip_mm, humidity, cloud)
# A tibble: 24 × 8
   time                temp_c wind_kph wind_dir pressure_mb precip_mm humidity cloud
   <dttm>               <dbl>    <dbl> <chr>          <dbl>     <dbl>    <int> <int>
 1 2021-08-01 00:00:00   16.6     17.3 NNE             1026         0       78     0
 2 2021-08-01 01:00:00   16.2     16.7 NNE             1025         0       76     0
 3 2021-08-01 02:00:00   15.9     16.1 NNE             1025         0       74     0
 4 2021-08-01 03:00:00   15.5     15.5 N               1024         0       71     0
 5 2021-08-01 04:00:00   15.6     15   N               1024         0       68     1
 6 2021-08-01 05:00:00   15.6     14.5 N               1024         0       64     2
 7 2021-08-01 06:00:00   15.7     14   N               1023         0       61     2
 8 2021-08-01 07:00:00   16.9     13.3 N               1023         0       55     5
 9 2021-08-01 08:00:00   18.2     12.6 N               1023         0       50     7
10 2021-08-01 09:00:00   19.4     11.9 N               1023         0       45     9
11 2021-08-01 10:00:00   21.4     11.5 NNE             1023         0       42     9
12 2021-08-01 11:00:00   23.5     11.2 NNE             1022         0       38     9
13 2021-08-01 12:00:00   25.5     10.8 NE              1021         0       35     8
14 2021-08-01 13:00:00   25.6     11.8 NE              1020         0       38     6
15 2021-08-01 14:00:00   25.6     12.7 NE              1019         0       40     3
16 2021-08-01 15:00:00   25.7     13.7 ENE             1018         0       43     0
17 2021-08-01 16:00:00   24.5     13.8 ENE             1018         0       48     0
18 2021-08-01 17:00:00   23.3     13.9 NE              1018         0       53     0
19 2021-08-01 18:00:00   22.1     14   NE              1018         0       58     0
20 2021-08-01 19:00:00   21.1     12   ENE             1019         0       60     0
21 2021-08-01 20:00:00   20.1     10   E               1019         0       61     0
22 2021-08-01 21:00:00   19.1      7.9 ESE             1020         0       63     0
23 2021-08-01 22:00:00   19.2      8.8 SSE             1021         0       64     0
24 2021-08-01 23:00:00   19.2      9.6 SSW             1021         0       65     0
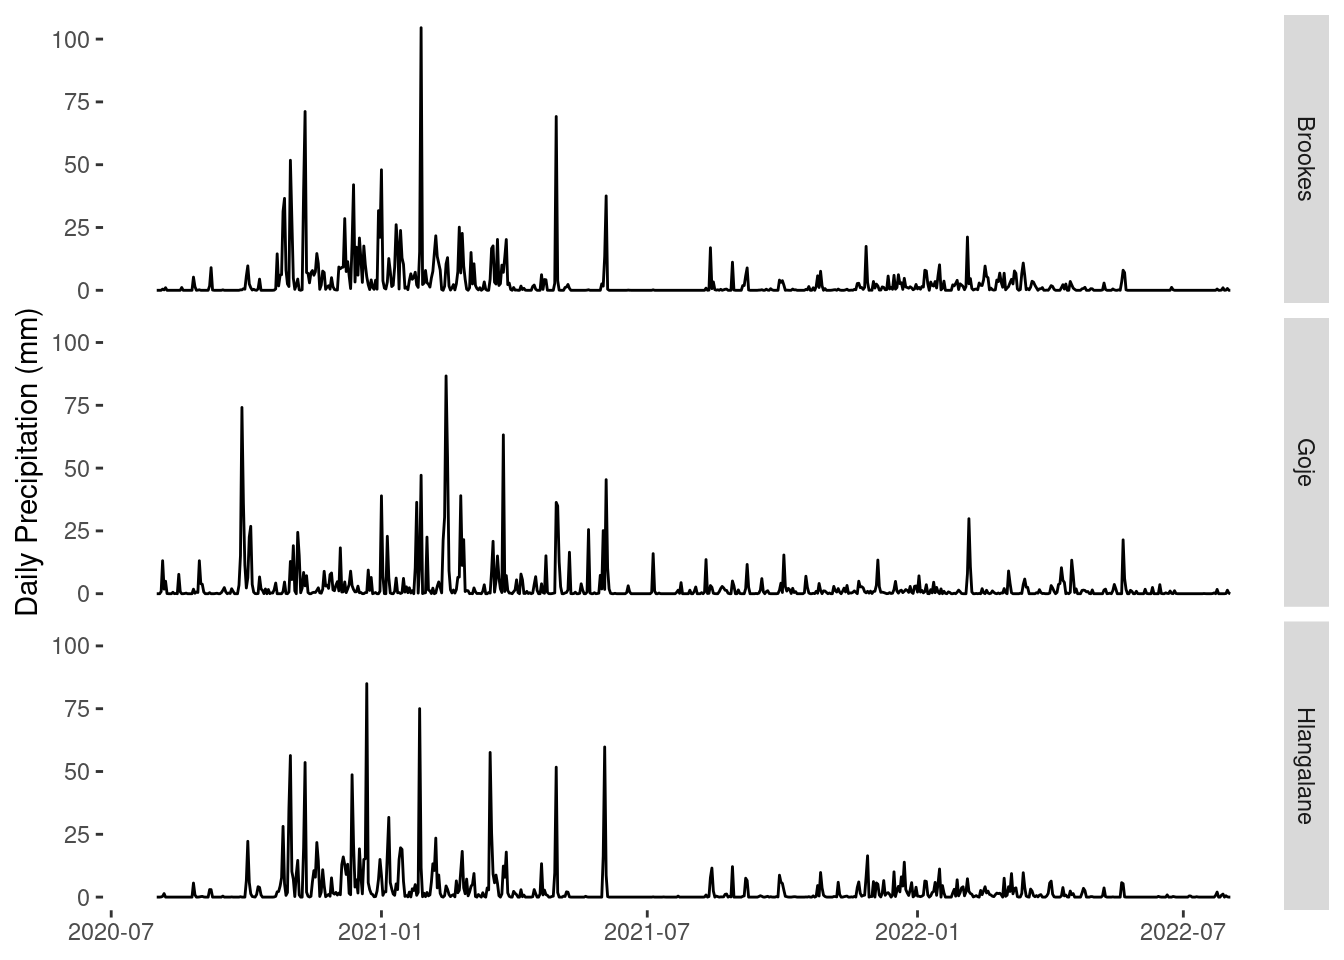
We’ll wrap up with a few plots of daily aggregated data. First the total daily precipitation.

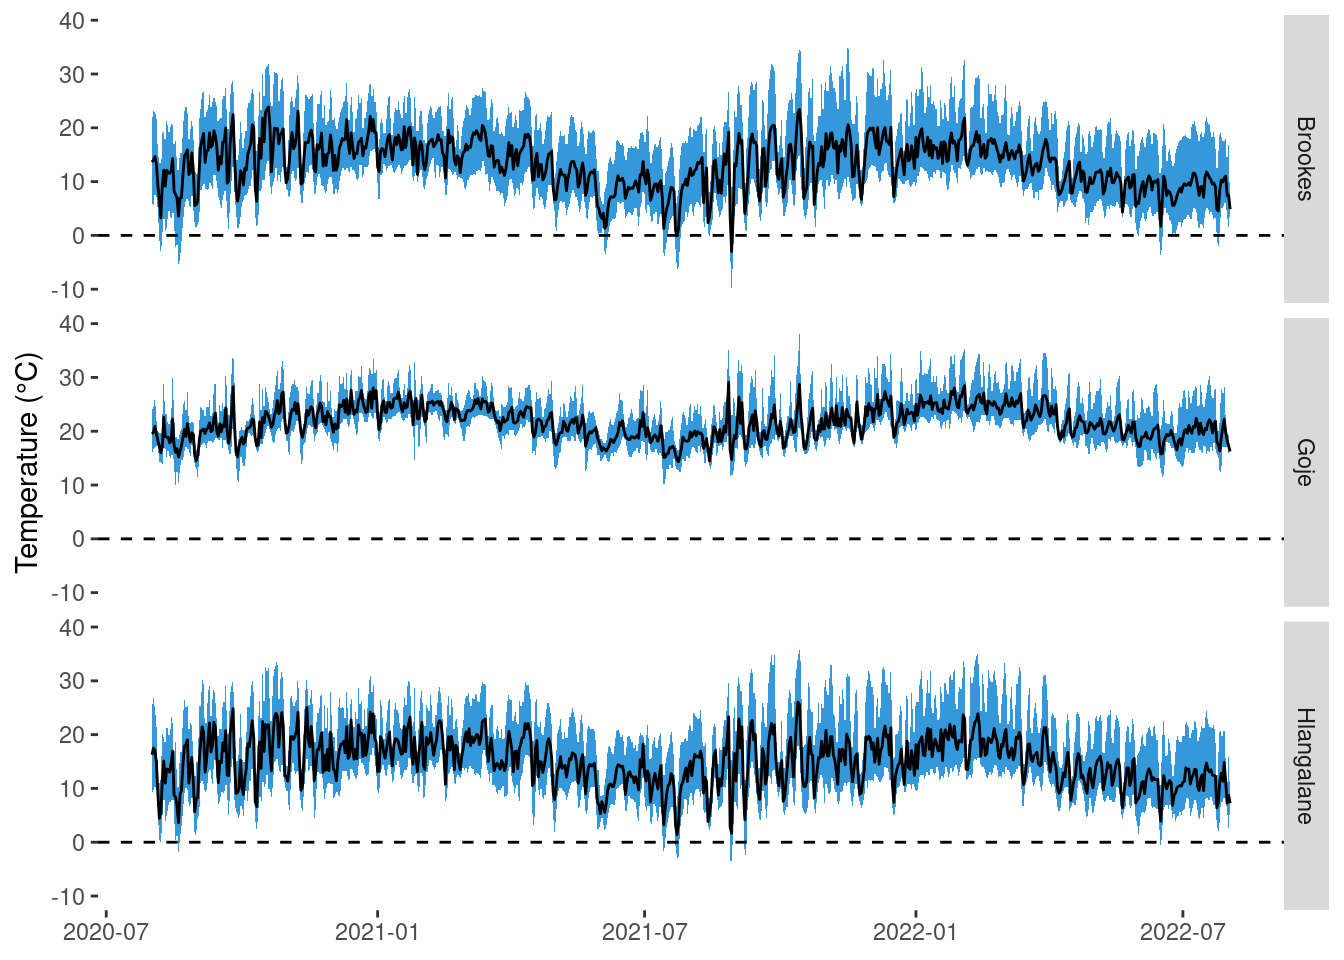
Looks like a wet year followed by a dry year. Finally the daily temperature (average is solid line and ribbon gives range).

These data are going to be particularly useful for our models.