In a previous post I took a look at some granular weather data that I acquired via the Weather API. One interesting application of these data is calculating the Fire Danger Index (FDI), which measures the degree of fire danger using information on dryness, wind speed, temperature and humidity.
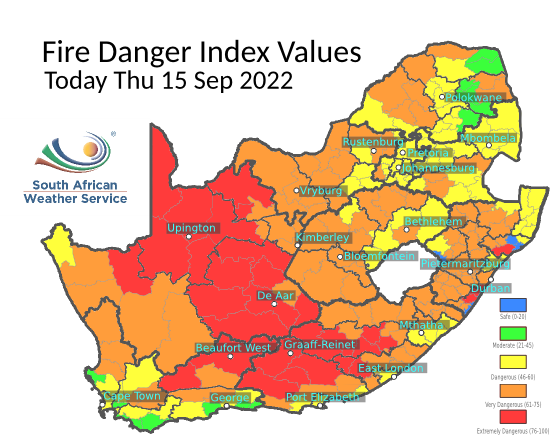
FDI is often presented at a fairly coarse spatial resolution. However, since we have point weather measurements we are able to calculate FDI at specific locations.
The environmental parameters used to calculate FDI are:
- temperature (°C)
- relative humidity (%)
- wind speed (km.h)
- previous rain (days since last rain and how much fell).
All of these parameters are available in (or can be derived from) the Weather API data.
The relationship between FDI and these parameters is determined via a set of lookup tables. I wrote a function, fdi(), to capture the associated logic. First let’s take that function for a spin on some test scenarios:
# SAFE (FDI = 7)
#
# temperature       10 °C
# humidity          50 %
# wind              10 km/hr
# days since rain   1
# rain              20 mm
#
fdi(10, 50, 10, 1, 20)
[1] 7# EXTREME (FDI = 81)
#
# temperature 40 °C
# humidity 30 %
# wind 30 km/hr
# days since rain 15
# rain 5 mm
#
fdi(40, 30, 30, 15, 5)[1] 81Looks good. Now we can apply fdi() to the historical weather data. The values used for temperature, humidity and wind speed are the daily averages. The results look like this:
# A tibble: 2,151 × 9
name date temperature rain humidity wind last_rain days_rain fdi
<chr> <date> <dbl> <dbl> <dbl> <dbl> <dbl> <dbl> <dbl>
1 Brookes 2020-08-05 9.30 0.47 68.2 5.02 0.47 0 20
2 Brookes 2020-08-06 6.50 0.16 57.9 7.87 0.16 0 21
3 Brookes 2020-08-07 3.27 1.02 58.7 6.18 1.02 0 18
4 Brookes 2020-08-08 9.28 0 36.2 8.17 1.02 1 23
5 Brookes 2020-08-09 12.1 0 37.5 17.4 1.02 2 40
6 Brookes 2020-08-10 9.16 0 27.0 5.54 1.02 3 36
7 Brookes 2020-08-11 12.1 0 21.8 9.33 1.02 4 46
8 Brookes 2020-08-12 11.6 0 16.8 5.23 1.02 5 43
9 Brookes 2020-08-13 11.5 0 19 10.3 1.02 6 47
10 Brookes 2020-08-14 12.0 0 24.9 5.85 1.02 7 40
# … with 2,141 more rows
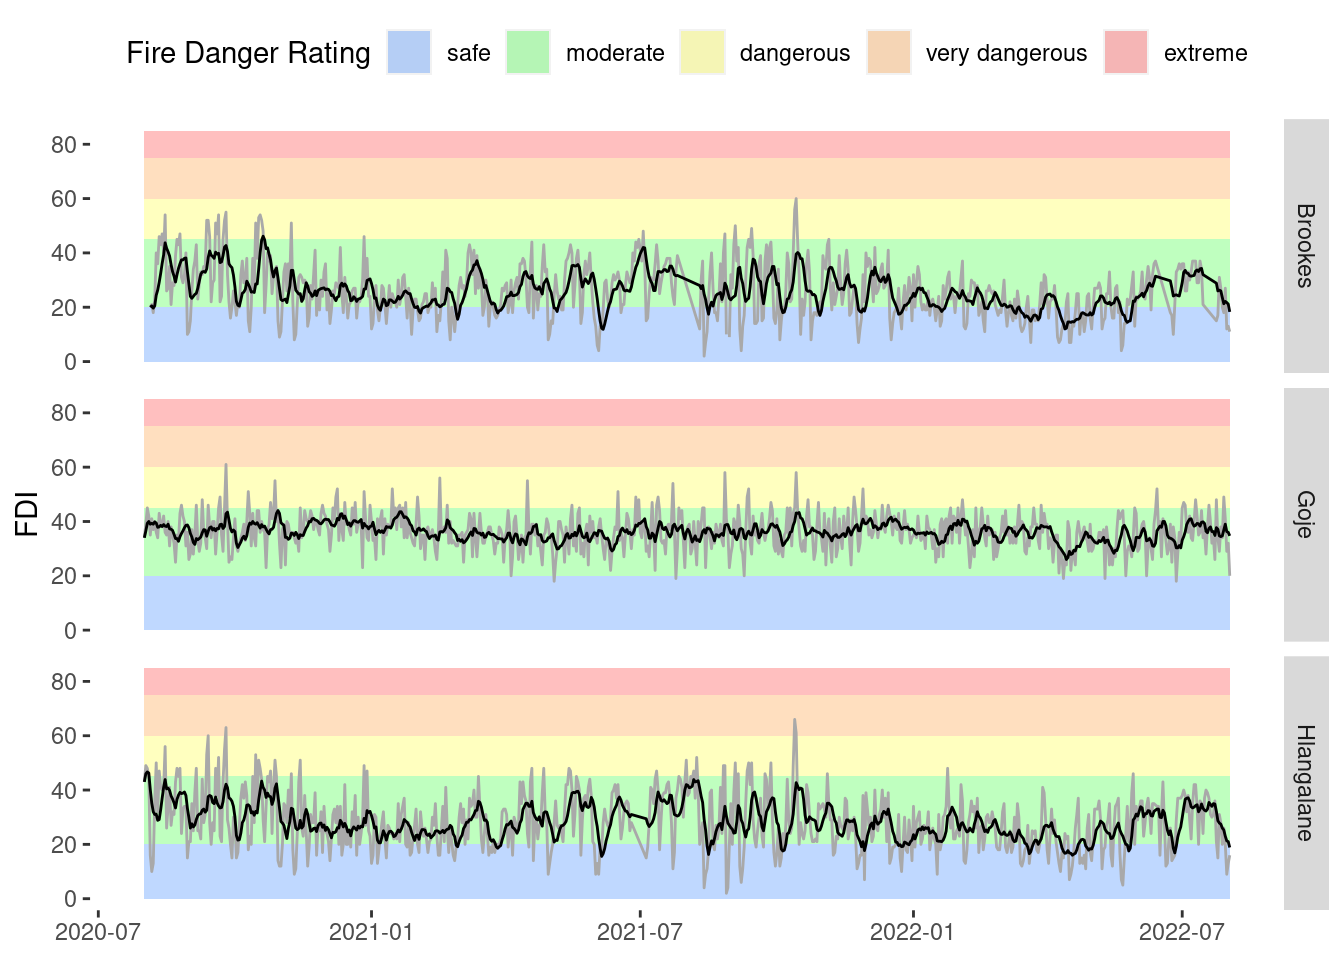
# ℹ Use `print(n = ...)` to see more rowsFinally we can take a look at how FDI varies with time at three sites (Brookes, Goje and Hlangalane). In the plots below the daily FDI values are reflected in the grey curves and a one week running average is overlaid in black.
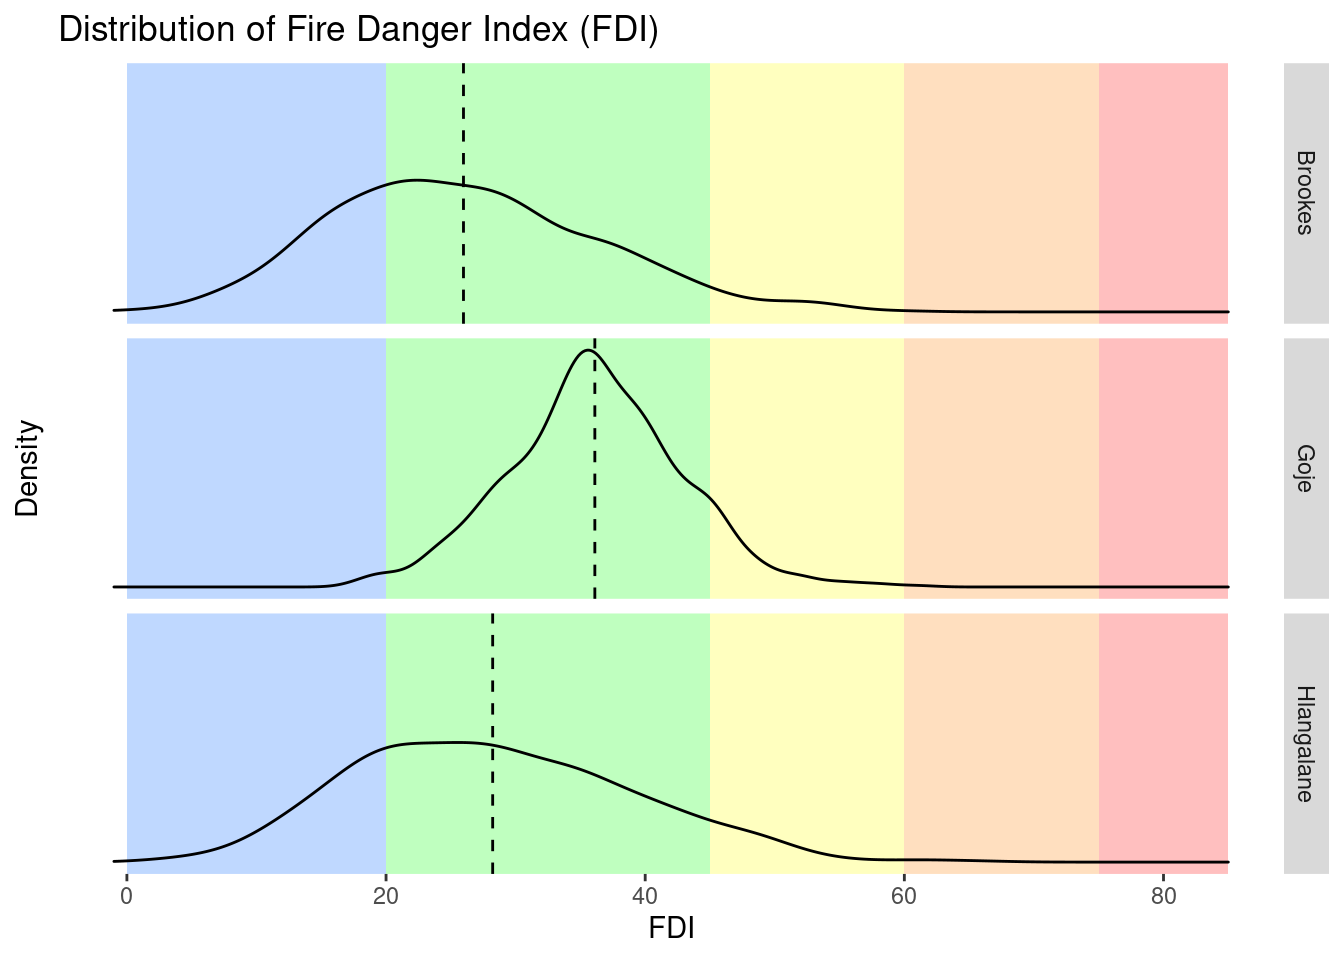
The distribution of FDI at each of the sites is given in the density plots below. The average FDI at each site is indicated by the vertical dashed line. FDI at Goje is significantly less variable than at the other two sites, being strongly peaked at a value around 35. FDI is more variable at Brookes and Hlangalane, but on average is lower than that at Goje.
Why is FDI at Goje so different to the other two sites? Let’s see if we can get a quick understanding by looking at some summary statistics. Below are the average values of the environmental parameters used to calculate FDI.
# A tibble: 3 × 6
  name       temperature humidity  wind last_rain  rain
  <chr>            <dbl>    <dbl> <dbl>     <dbl> <dbl>
1 Brookes           13.4     62.7  6.74      3.23  3.00
2 Goje              21.7     74.4 18.0       2.98  2.68
3 Hlangalane        15.1     62.2  7.56      3.12  2.73
The average period since last rain and volume of rain are similar across all three sites. However, Goje has more wind, higher temperatures and more humidity than the other sites. The general weather conditions at Goje are thus substantially different to those at the other two sites, so it’s not surprising that this is reflected in FDI.
The function for calculating FDI is wrapped up in a small R package here.