Squares & Spirals
Using R to replicate a grid of spirals created by drawing a recursive pattern of square-like figures. Inspired by a TikTok video.
While trolling the internet aimlessly this morning, this TikTok video caught my attention.
How difficult would it be to replicate that in R?
# Add a new point.
#
# proportion - How far along the opposite edge should the new point be located?
#
next_point <- function(p, proportion = 0.1) {
L <- length(p)
A <- p[[L-3]]
B <- p[[L-2]]
list(A + (B-A) * proportion)
}
# Add a series of new points.
#
make_spiral <- function(p, N = 250) {
for (i in seq(N)) {
p <- c(p, next_point(p))
}
do.call(rbind, p) %>%
as.data.frame() %>%
setNames(c("x", "y")) %>%
mutate(
group = row_number() %% 4
)
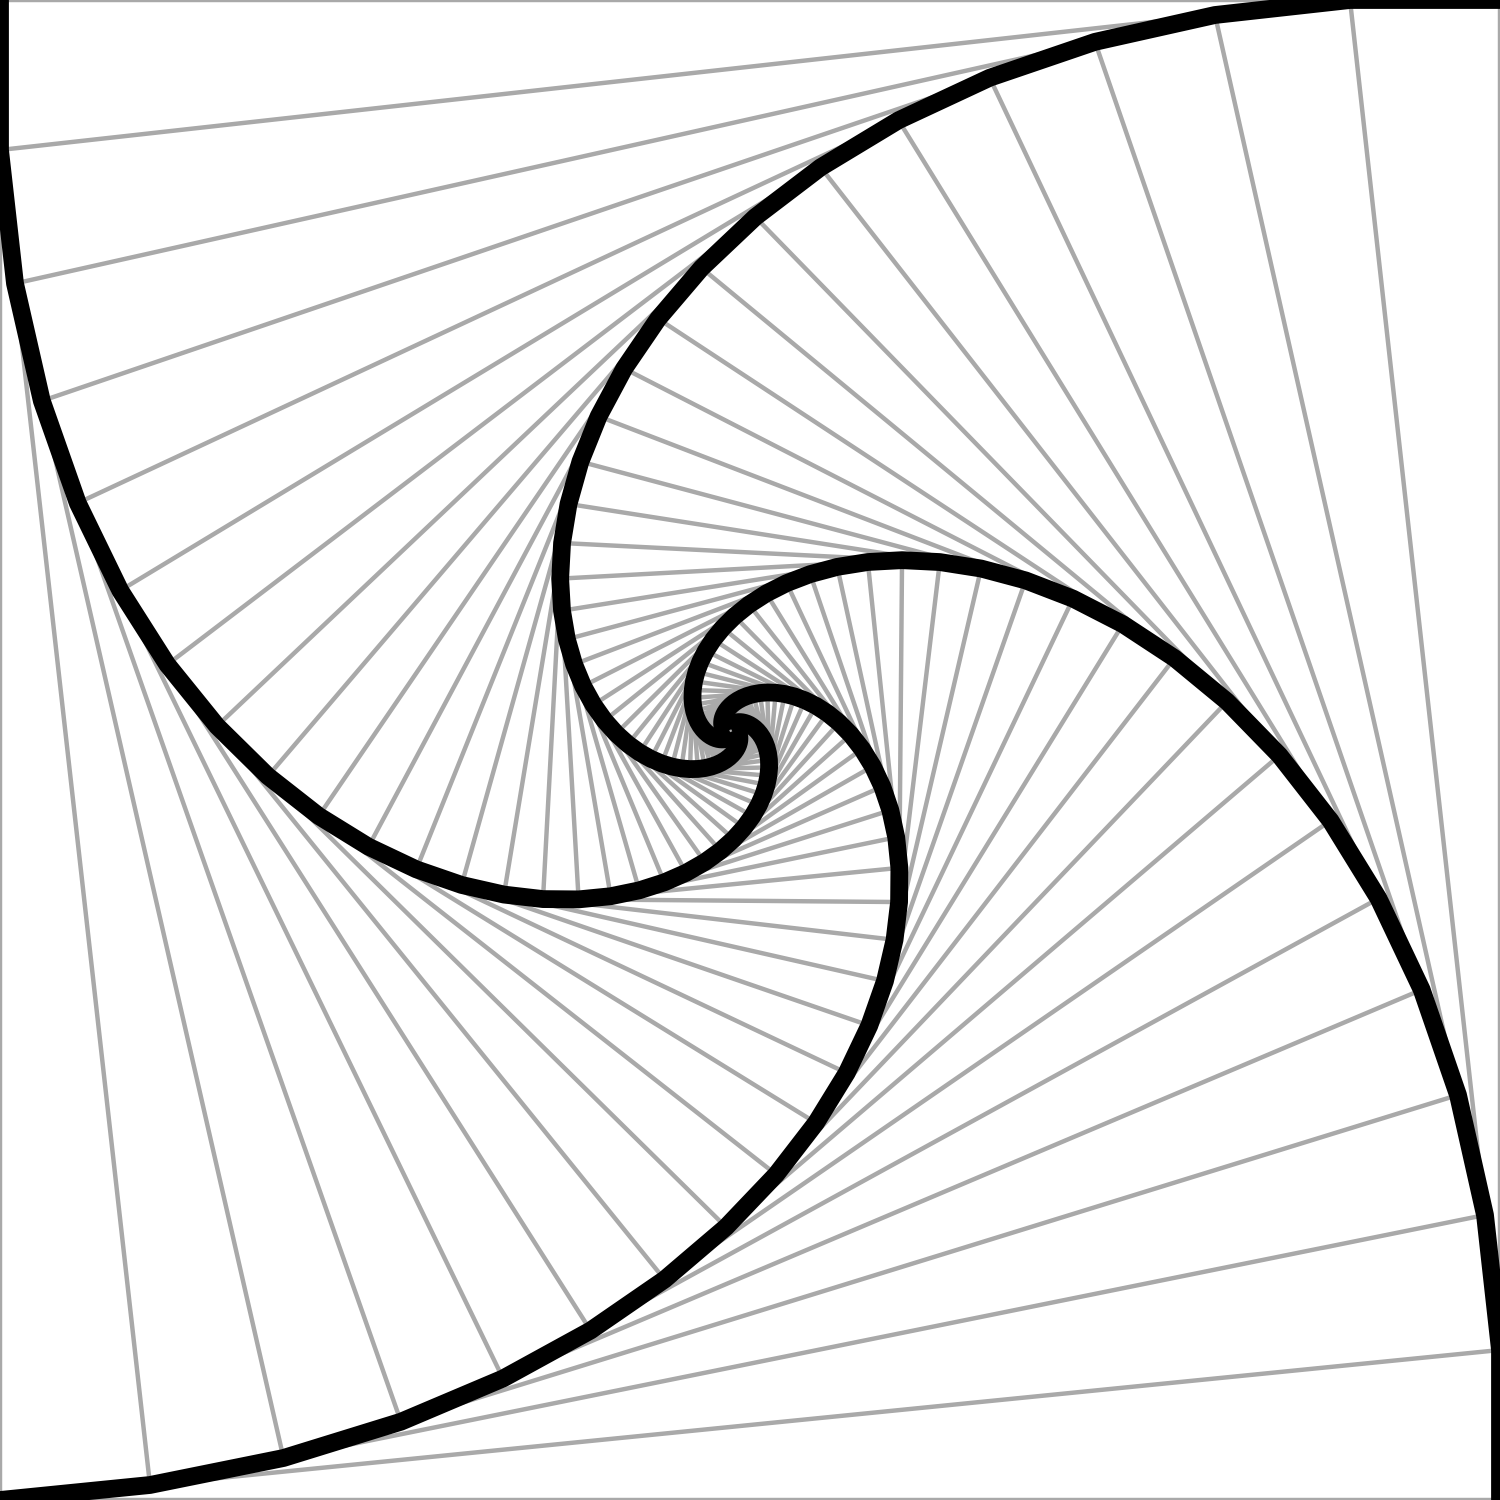
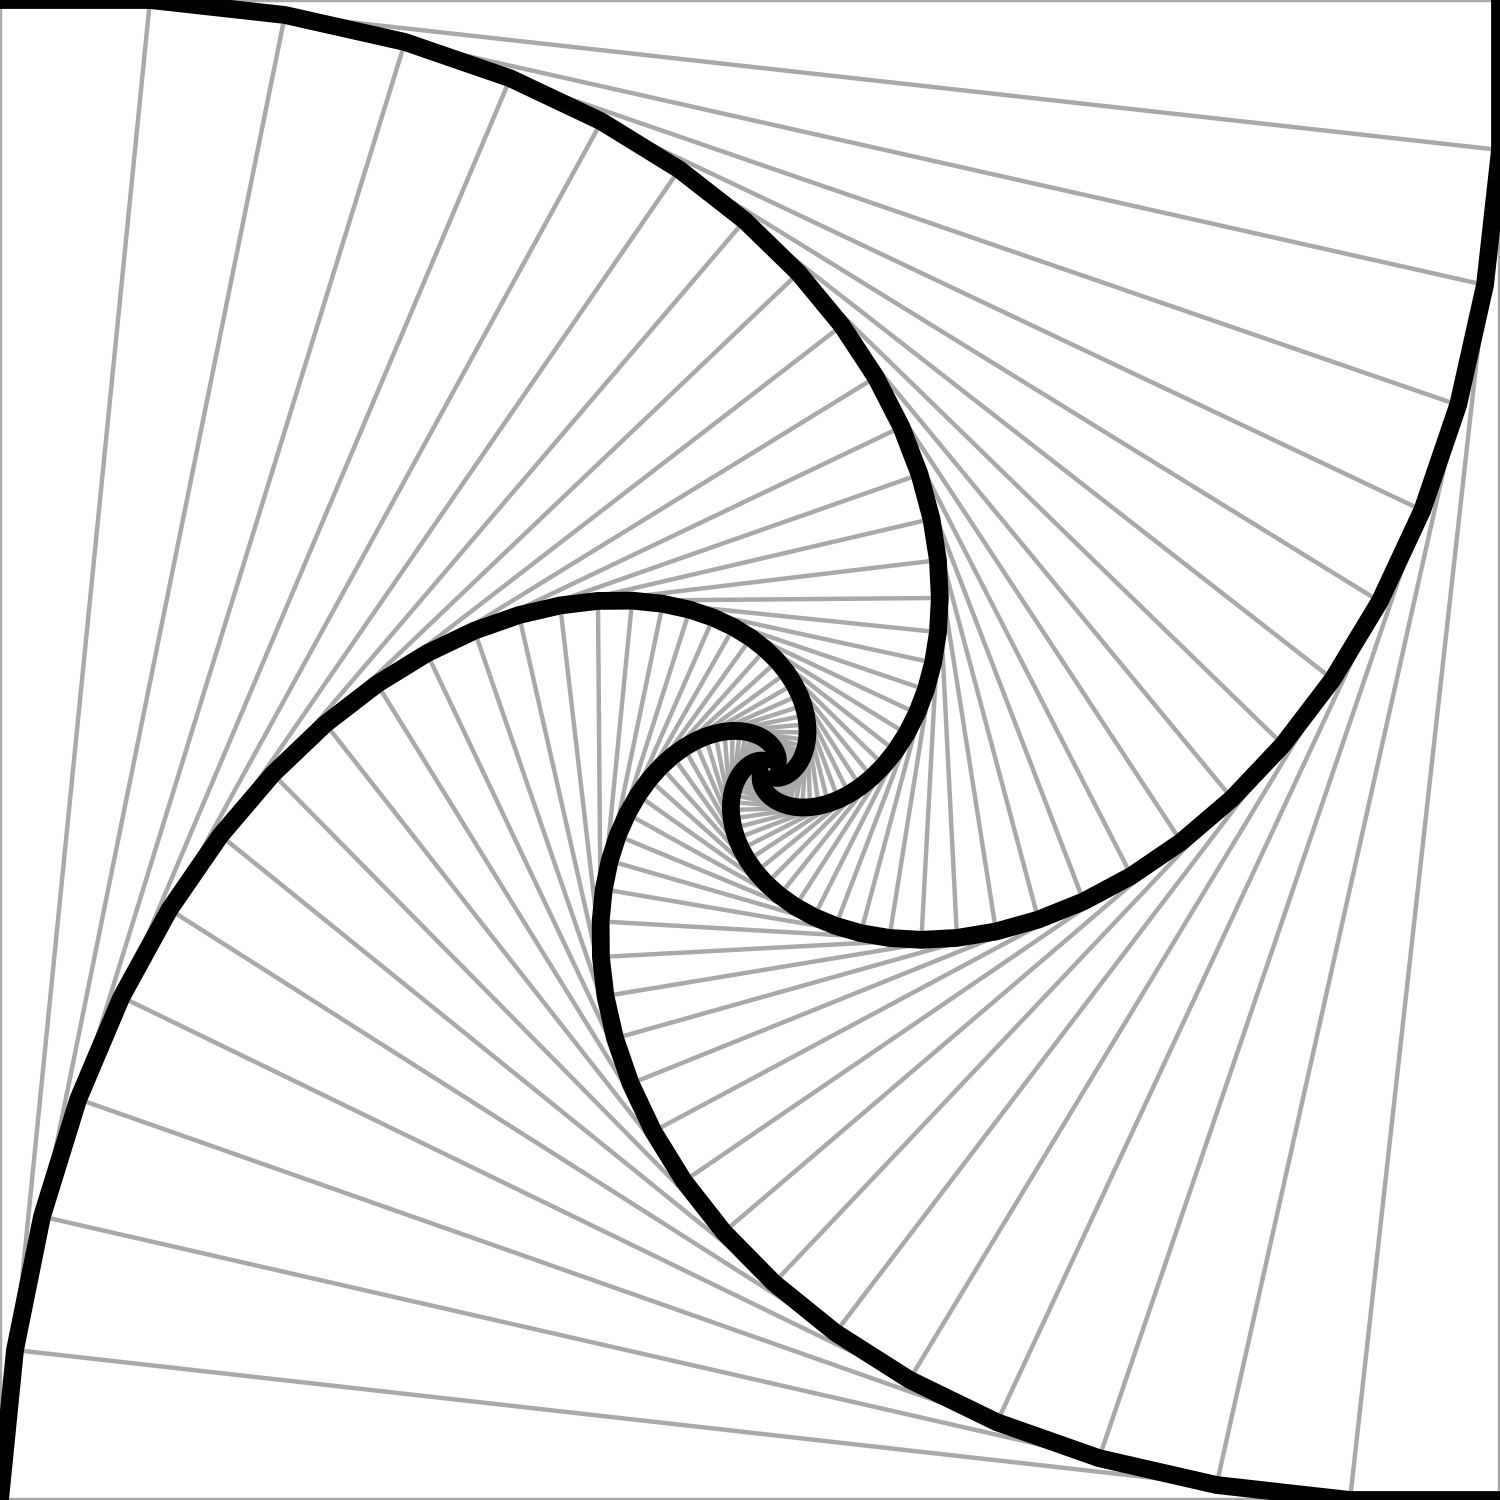
}Make a right-handed spiral.
spiral_right <- make_spiral(
  # Four initial points (a square centred on the origin).
  list(
    c(-1, -1),
    c(-1, +1),
    c(+1, +1),
    c(+1, -1),
    c(-1, -1)
  )
)

head(spiral_right)
x y group
1 -1.0 -1 1
2 -1.0 1 2
3 1.0 1 3
4 1.0 -1 0
5 -1.0 -1 1
6 -0.8 1 2And a left-handed spiral.
spiral_left <- make_spiral(
  list(
    c(-1, -1),
    c(+1, -1),
    c(+1, +1),
    c(-1, +1),
    c(-1, -1)
  )
)
Now plot the spirals using {ggplot2}.
plot_spiral <- function(p) {
  ggplot(p, aes(x, y)) +
    geom_path(col = "darkgrey", lwd = 0.5) +
    geom_path(data = p %>% filter(group == 0), lwd = 2) +
    geom_path(data = p %>% filter(group == 1), lwd = 2) +
    geom_path(data = p %>% filter(group == 2), lwd = 2) +
    geom_path(data = p %>% filter(group == 3), lwd = 2) +
    coord_fixed() +
    scale_x_continuous(expand = expansion(0, 0)) +
    scale_y_continuous(expand = expansion(0, 0)) +
    theme(
      panel.background = element_rect(fill = "white", colour = NA),
      panel.grid = element_blank(),
      panel.border = element_blank(),
      plot.margin = unit(c(0, 0, 0, 0), "null"),
      panel.spacing = unit(c(0, 0, 0, 0), "null"),
      axis.ticks = element_blank(),
      axis.text = element_blank(),
      axis.title = element_blank(),
      axis.line = element_blank(),
      legend.position = "none",
      axis.ticks.length = unit(0, "null"),
      legend.spacing = unit(0, "null")
    )
}
The two spirals were saved to files spiral-left.png and spiral-right.png.
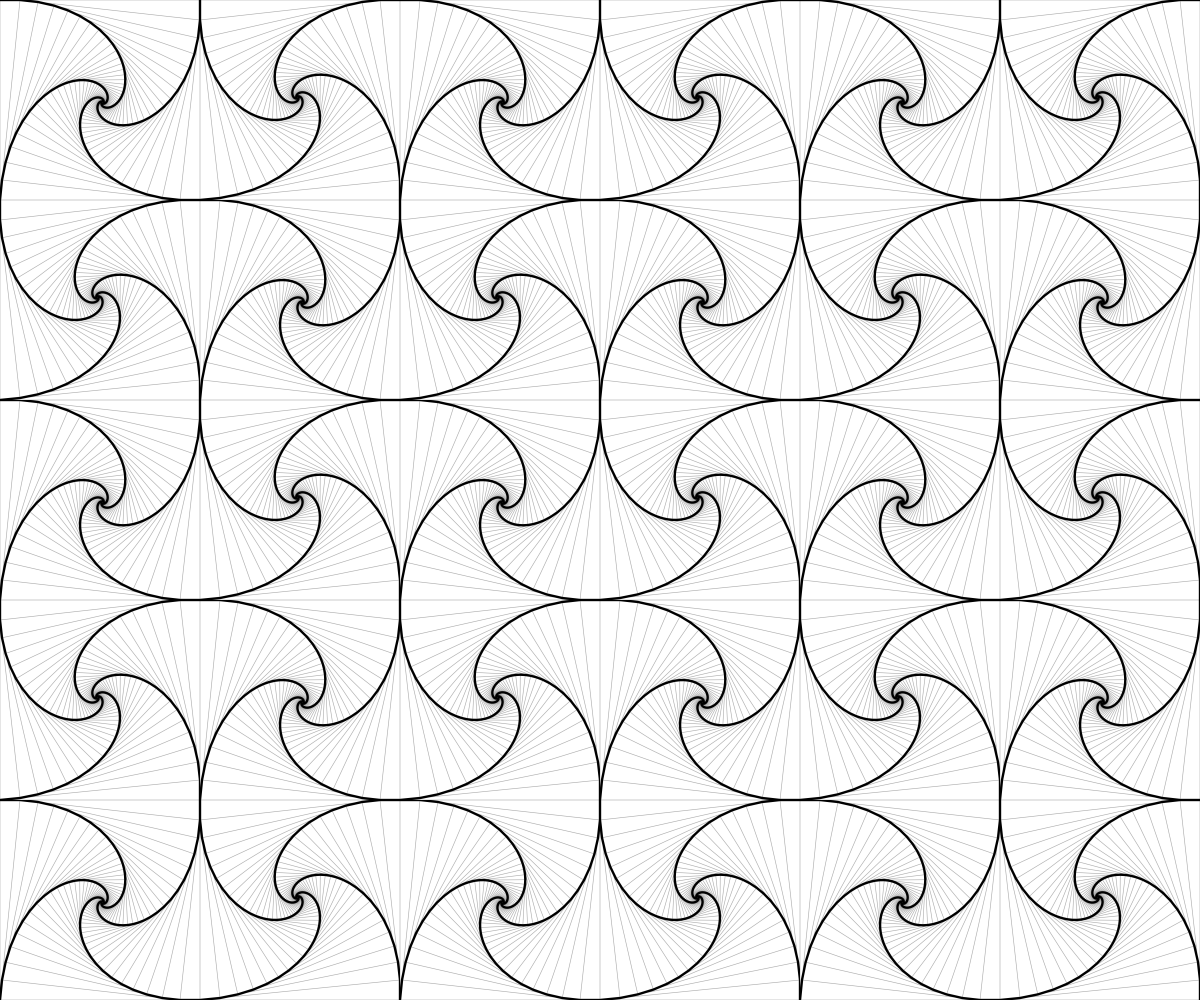
Then use the {magick} package to concatenate those images together in a grid. And abracadabra!