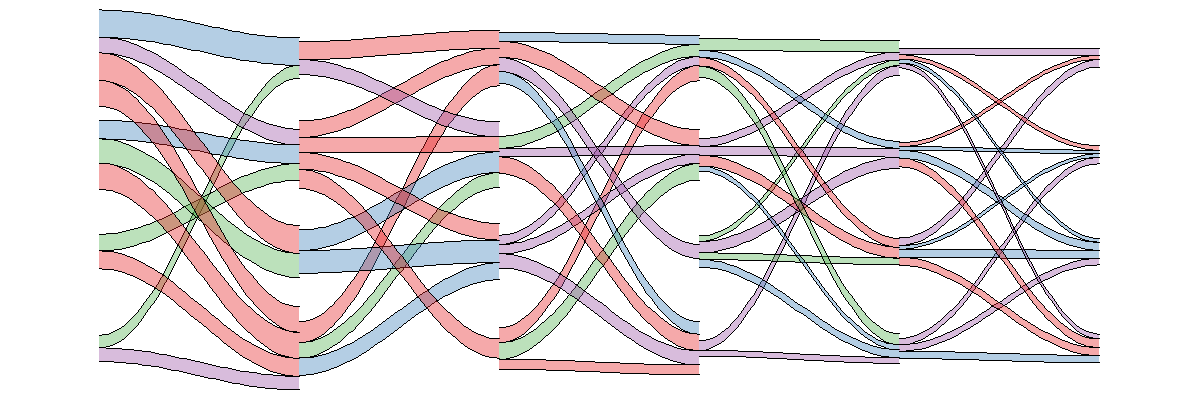
Following up on my previous post about generating Sankey plots with the riverplot package. It’s also possible to generate plots which have constant coloured edges.
Here’s how (using some of the data structures from the previous post too):
edges$col = sample(palette, size = nrow(edges), replace = TRUE)
edges$edgecol <- "col"
river <- makeRiver(nodes, edges)
style <- list(nodestyle= "invisible")